EXAMPLE 7.18 Is the Sample Size Large Enough?
Recall Example 7.2 (pages 363–364) on the daily amount of time using a smartphone. A friend of yours is planning to compare her institutional average with the UK average of 119 minutes per day. She decides that a mean at least 10 minutes smaller is useful in practice. Can she rely on a sample of 10 students to detect a difference of this size?
She wishes to compute the power of the test for
against the alternative that when . This gives us most of the information we need to compute the power. The other important piece is a rough guess of the size of . In planning a large study, a pilot study is often run for this and other purposes. In this case, she can use the standard deviation from your institution. She will therefore round up and use and in the approximate calculation.
403
Step 1. The test with 10 observations rejects at the 5% significance level if the statistic
is less than the lower 5% point of , which is −1.833. Taking , the event that the test rejects is, therefore,
Step 2. The power is the probability that when . Taking , we find this probability by standardizing :
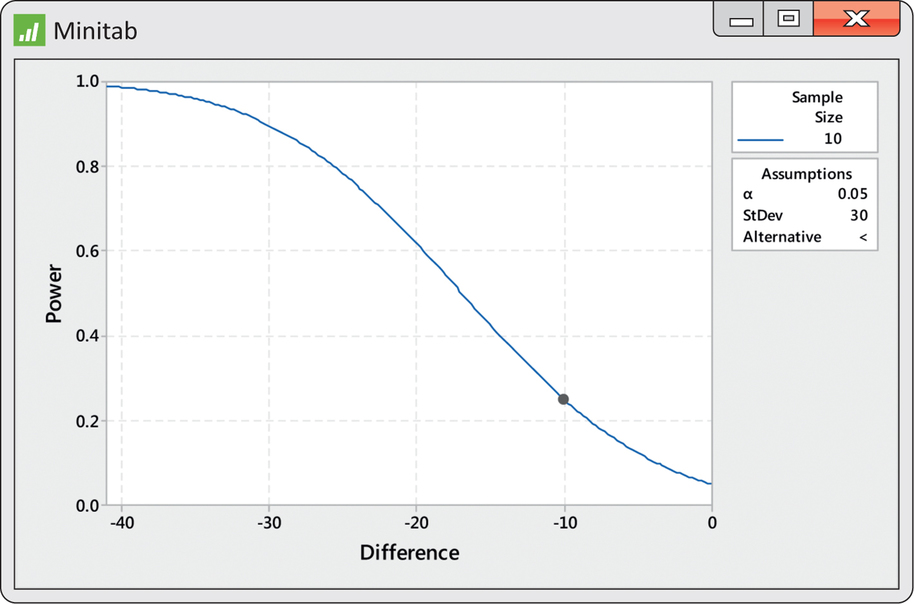
A mean value of 109 minutes will produce significance at the 5% level in only 21.8% of all possible samples. Figure 7.13 shows Minitab output for the exact power calculation. It is about 25% and is represented by a dot on the power curve at a difference of −10. This curve is very informative. We see that with a sample size of 10, the power is greater than 80% only for differences larger than about 26 minutes. Your friend will definitely want to increase the sample size.
