EXAMPLE 7.19 Active versus Failed Companies
CASE 7.2 In Case 7.2, we compared the cash flow margin for 74 active and 27 failed companies. Using the pooled two-sample procedure, the difference was statistically significant (t=2.82,df=99,P=0.005). Because this study is a year old, let’s plan a similar study to determine if these findings continue to hold.
Should our new sample have similar numbers of firms? Or could we save resources by using smaller samples and still be able to declare that the successful and failed firms are different? To answer this question, we do a power calculation.
Step 1. We want to be able to detect a difference in the means that is about the same as the value that we observed in our previous study. So, in our calculations, we will use μ1−μ2=12.00. We are willing to assume that the standard deviations will be about the same as in the earlier study, so we take the standard deviation for each of the two groups of firms to be the pooled value from our previous study, σ=19.59.
We need only two pieces of additional information: a significance level α and the sample sizes n1 and n2. For the first, we will choose the standard value α=0.05. For the sample sizes, we want to try several different values. Let’s start with n1=26 and n2=26.
Step 2. The degrees of freedom are n1+n2−2=50. The critical value is t∗=2.009, the value from Table D for a two-sided α=0.05 significance test based on 50 degrees of freedom.
Step 3. The noncentrality parameter is
δ=12.0019.59√126+126=12.005.43=2.21
Step 4. Software gives the power as 0.582. The Normal approximation is very accurate:
P(Z>t∗−δ)=P(Z>−0.201)=0.5793
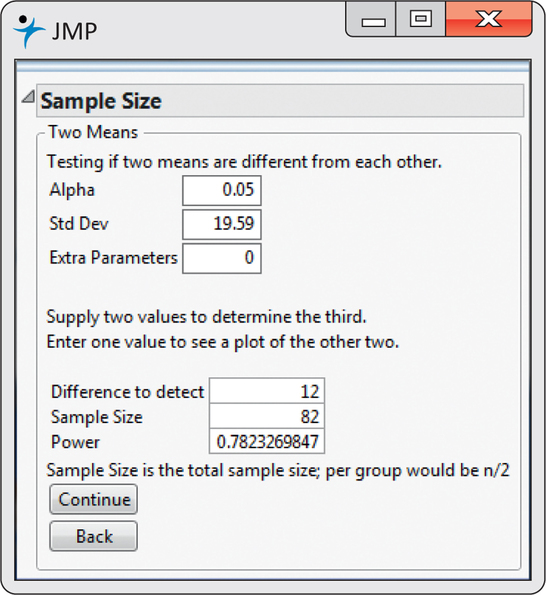
If we repeat the calculation with n1=41 and n2=41, we get a power of 78%. This result using JMP is shown in Figure 7.14. We need a relatively large sample to detect this difference.
