EXAMPLE 7.2 Does the Average Amount of Time Using a Smartphone at Your Institution Differ from the UK Average?
smrtphn
CASE 7.1 Can the results of the Samsung and be generalized to the population of students at your institution? To help answer this, we can use the SRS in Example 7.1 (page 361) to test whether the average time using a smartphone at your institution differs from the UK average of 119 minutes. Specifically, we want to test
at the 0.05 significance level. Recall that , and . The test statistic is
This means that the sample mean is slightly more than one standard error below the null hypothesized value of 119.
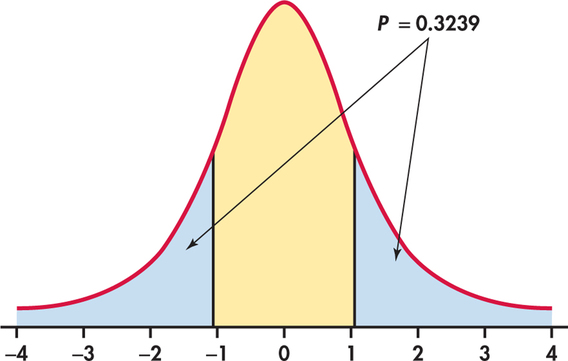
Because the degrees of freedom are , this statistic has the distribution. Figure 7.3 shows that the -value is , where has the distribution. From Table D, we see that and .
Therefore, we conclude that the -value is between and . Software gives the exact value as . These data are compatible with an average of minutes per day. Under , a difference this large or larger would occur about one time in three simply due to chance. There is not enough evidence to reject the null hypothesis at the 0.05 level.
| 0.20 | 0.15 | |
| 0.896 | 1.119 | |
364
