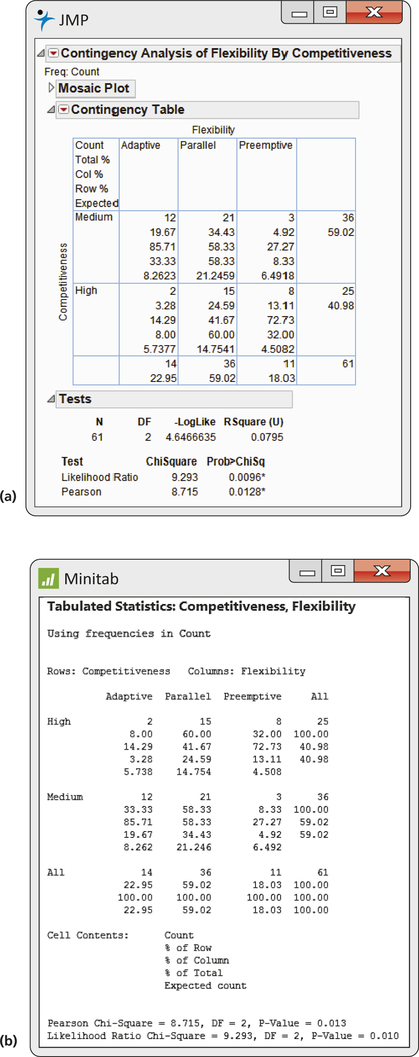
EXAMPLE 9.4 Software Output
flxcom
Figure 9.1 shows the output from JMP, Minitab, and SPSS, for the data of Case 9.1. We named the variables Competitiveness and Flexibility. The two-way table appears in the outputs in expanded form. Each cell contains five entries. They appear in different orders or with different labels, but all three outputs contain the same information. The count is the first entry in all three outputs. The row and column totals appear in the margins, just as in Example 9.3. The cell count as a percent of the row total is variously labeled as “Row %,” “% of Row,” or “% within Competitiveness.” The row % for the cell with the count for High Competitiveness and Preemptive Flexibility is 8/25, or 32%. Similarly, the cell count as a percent of the column total is also given.
459

460