SECTION 10.3 Exercises
For Exercises 10.55 and 10.56, see page 520; and for 10.57 to 10.59, see page 523.
U.S. versus overseas stock returns. How are returns on common stocks in overseas markets related to returns in U.S. markets? Consider measuring U.S. returns by the annual rate of return on the Standard & Poor’s 500 stock index and overseas returns by the annual rate of return on the Morgan Stanley Europe, Australasia, Far East (EAFE) index. Both are recorded in percents. Here is part of the Minitab output for regressing the EAFE returns on the S&P 500 returns for the 25 years 1989 to 2013.
The regression equation is
EAFE=−2.71+0.816 S&P
Analysis of Variance
| Source | DF | SS | MS | F |
| Regression | 5587.0 | |||
| Error | ||||
| Total | 24 | 9940.6 |
Exercises 10.60 through 10.64 use this output.
Question 10.60
10.60 The ANOVA table.
Complete the analysis of variance table by filling in the “Residual Error” row and the other missing items in the DF, MS, and F columns.
eafe
Question 10.61
10.61 s and r2.
What are the values of the regression standard error s and the squared correlation r2?
10.61
s=13.758, r2=0.5621.
eafe
Question 10.62
10.62 Estimating the standard error of the slope.
The standard deviation of the S&P 500 returns for these years is 18.70%. From this and your work in the previous exercise, find the standard error for the least-squares slope b1. Give a 90% confidence interval for the slope β1 of the population regression line.
eafe
Question 10.63
10.63 Inference for the intercept?
The mean of the S&P 500 returns for these years is 11.97. From this and information from the previous exercises, find the standard error for the least-squares intercept b0. Use this to construct a 95% confidence interval. Finally, explain why the intercept β0 is meaningful in this example.
eafe
10.63
SEb0=3.2868. The interval is (−9.50691, 4.09135). This intercept is meaningful because it tells us what the EAFE is when the S&P is 0, meaning no return in U.S. markets.
Question 10.64
10.64 Predicting the return for a future year.
Suppose the S&P annual return for a future year is 0%. Using the information from the previous four exercises, construct the appropriate 95% interval. Also, explain why this interval is or is not the same interval constructed in Exercise 10.63.
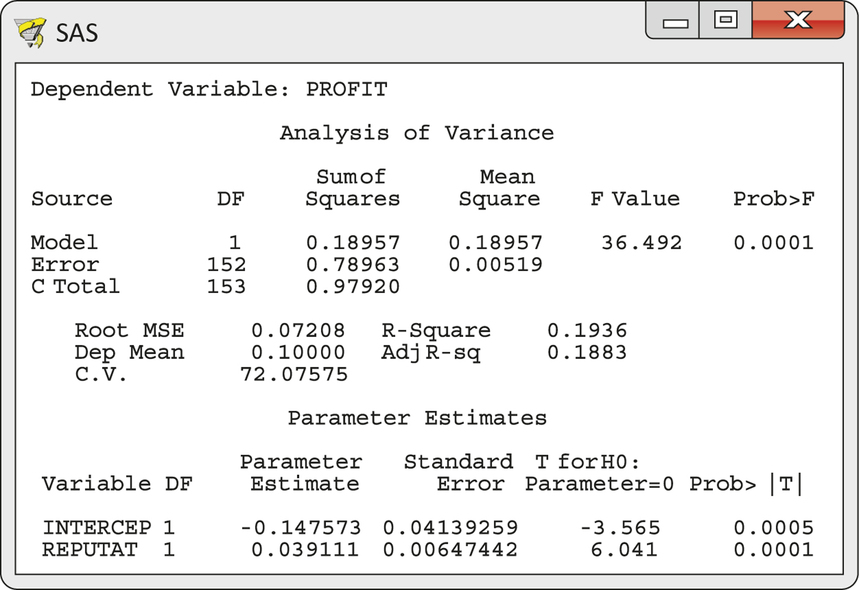
Corporate reputation and profitability. Is a company’s reputation (a subjective assessment) related to objective measures of corporate performance such as its profitability? One study of this relationship examined the records of 154 Fortune 500 firms.18 Corporate reputation was measured on a scale of 1 to 10 by a Fortune magazine survey. Profitability was defined as the rate of return on invested capital. Figure 10.19 contains SAS output for the regression of profitability (PROFIT) on reputation score (REPUTAT). The format is very similar to the Excel and Minitab output we have seen, with minor differences in labels. Exercises 10.65 through 10.72 concern this study. You can take it as given that examination of the data shows no serious violations of the conditions required for regression inference.
Question 10.65
10.65 Significance in two senses.
- Is there good evidence that reputation helps explain profitability? (State hypotheses, give a test statistic and P-value, and state a conclusion.)
- What percent of the variation in profitability among these companies is explained by regression on reputation?
- Use your findings in parts (a) and (b) as the basis for a short description of the distinction between statistical significance and practical significance.
10.65
(a) H0:β1=0, Ha:β1≠0. t=6.041, P-value=0.0001. There is significant evidence that reputation explains profitability. (b) r2=19.36%. (c) Though the data are very statistically significant, reputation only explains 19.36% of the variation in profitability, so there are likely other predictors that can also predict profitability.
Question 10.66
10.66 Estimating the slope.
Explain clearly what the slope β1 of the population regression line tells us in this setting. Give a 99% confidence interval for this slope.
Question 10.67
10.67 Predicting profitability.
An additional calculation shows that the variance of the reputation scores for these 154 firms is s2x=0.8101. SAS labels the regression standard error s as “Root MSE” and the sample mean of the responses ˉy as “Dep Mean.” Starting from these facts, give a 95% confidence interval for the mean profitability (return on investment) for all companies with reputation score x=7. [Hint: The least-squares regression line always goes through (ˉx,ˉy).]
10.67
The mean response interval is (0.118955, 0.133453).
Question 10.68
10.68 Predicting profitability.
A company not covered by the Fortune survey has reputation score x=7. Will a 95% prediction interval for this company’s profitability be wider or narrower than the confidence interval found in the previous exercise? Explain why we should expect this. Then give the 95% prediction interval.
Question 10.69
10.69 F versus t.
How do the ANOVA F statistic and its P-value relate to the t statistic for the slope and its P-value? Identify these results on the output and verify their relationship (up to roundoff error).
10.69
F=t2, the P-value is identical. 6.0412=36.494≈36.492. The P-value for both is 0.0001.
Question 10.70
10.70 The regression standard error.
SAS labels the regression standard error s as “Root MSE.” How can you obtain s from the ANOVA table? Do this, and verify that your result agrees with Root MSE.
Question 10.71
10.71 Squared correlation.
SAS gives the squared correlation r2 as “R-Square.” How can you obtain r2 from the ANOVA table? Do this, and verify that your result agrees with R-Square.
10.71
ModelSS/TotalSS=0.18957/0.9792=0.1936.
Question 10.72
10.72 Correlation.
The regression in Figure 10.19 takes reputation as explaining profitability. We could as well take reputation as in part explained by profitability. We would then reverse the roles of the variables, regressing REPUTAT on PROFIT. Both regressions lead to the same conclusions about the correlation between PROFIT and REPUTAT. What is this correlation r? Is there good evidence that it is positive?