1.1 Data
 This page includes Video Technology Manuals
 This page includes Statistical Videos
A statistical analysis starts with a set of data. We construct a set of data by first deciding what cases or units we want to study. For each case, we record information about characteristics that we call variables.
Cases, Labels, Variables, and Values
Cases are the objects described by a set of data. Cases may be customers, companies, subjects in a study, or other objects.
A label is a special variable used in some data sets to distinguish the different cases.
A variable is a characteristic of a case.
Different cases can have different values for the variables.
EXAMPLE 1.1 Restaurant Discount Coupons
coupons
A website offers coupons that can be used to get discounts for various items at local restaurants. Coupons for food are very popular. Figure 1.1 gives information for seven restaurant coupons that were available for a recent weekend. These are the cases. Data for each coupon are listed on a different line, and the first column has the coupons numbered from 1 to 7. The next columns gives the type of restaurant, the name of the restaurant, the item being discounted, the regular price, and the discount price.
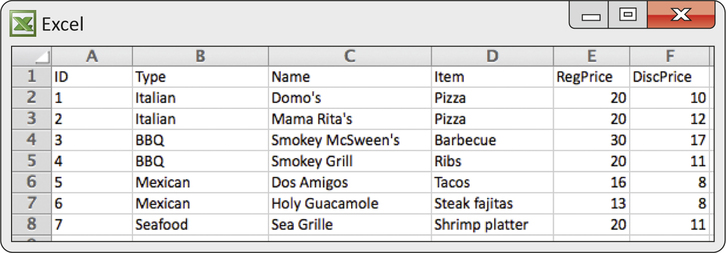
Some variables, like the type of restaurant, the name of the restaurant, and the item simply place coupons into categories. The regular price and discount price columns have numerical values for which we can do arithmetic. It makes sense to give an average of the regular prices, but it does not make sense to give an “average” type of restaurant. We can, however, do arithmetic to compare the regular prices classified by type of restaurant.
Categorical and Quantitative Variables
A categorical variable places a case into one of several groups or categories.
A quantitative variable takes numerical values for which arithmetic operations, such as adding and averaging, make sense.
EXAMPLE 1.2 Categorical and Quantitative Variables for Coupons
coupons
The restaurant discount coupon file has six variables: coupon number, type of restaurant, name of restaurant, item, regular price, and discount price. The two price variables are quantitative variables. Coupon number, type of restaurant, name of restaurant, and item are categorical variables.
An appropriate label for your cases should be chosen carefully. In our food coupon example, a natural choice of a label would be the name of the restaurant. However, if there are two or more coupons available for a particular restaurant, or if a restaurant is a chain with different discounts offered at different locations, then the name of the restaurant would not uniquely label each of the coupons.
Apply Your Knowledge
Question 1.1
1.1 How much is the discount worth?
Refer to Example 1.1. Add another column to the spreadsheet that gives the value of the coupon. Explain how you computed the entries in this column. Does the new column contain values for a categorical variable or for a quantitative variable? Explain your answer.
1.1
The value of the coupon is computed by subtracting the DiscPrice from the RegPrice. It is quantitative because arithmetic operations, like the average value, would make sense.
coupons
In practice, any set of data is accompanied by background information that helps us understand the data. When you plan a statistical study or explore data from someone else’s work, ask yourself the following questions:
- Who? What cases do the data describe? How many cases appear in the data?
- What? How many variables do the data contain? What are the exact definitions of these variables? In what unit of measurement is each variable recorded?
- Why? What purpose do the data have? Do we hope to answer some specific questions? Do we want to draw conclusions about cases other than the ones we actually have data for? Are the variables that are recorded suitable for the intended purpose?
Apply Your Knowledge
Question 1.2
1.2 Read the spreadsheet.
Refer to Figure 1.1. Give the regular price and the discount price for the Smokey Grill ribs coupon.
Question 1.3
1.3 Who, what, and why for the restaurant discount coupon data.
What cases do the data describe? How many cases are there? How many variables are there? What are their definitions and units of measurement? What purpose do the data have?
1.3
Who: The cases are coupons; there are 7 cases. What: There are 6 variables—ID, Type, Name, Item, RegPrice, and DiscPrice. Only RegPrice and DiscPrice have units in dollars. Why: The data might be used to compare coupons to one another to see which are better. We would not want to draw conclusions about other coupons not listed.
coupons
spreadsheet
The display in Figure 1.1 is from an Excel spreadsheet. Spreadsheets are very useful for doing the kind of simple computations that you did in Exercise 1.1. You can type in a formula and have the same computation performed for each row.

Note that the names we have chosen for the variables in our spreadsheet do not have spaces. For example, we could have used the name “Restaurant Name” for the name of the restaurant rather than Name. In some statistical software packages, however, spaces are not allowed in variable names. For this reason, when creating spreadsheets for eventual use with statistical software, it is best to avoid spaces in variable names. Another convention is to use an underscore (_) where you would normally use a space. For our data set, we could have used Regular_Price and Discount_Price for the two price variables.
EXAMPLE 1.3 Accounting Class Data
Suppose that you are a teaching assistant for an accounting class and one of your jobs is to keep track of the grades for students in two sections of the course. The cases are the students in the class. There are weekly homework assignments that are graded, two exams during the semester, and a final exam. Each of these components is given a numerical score, and the components are added to get a total score that can range from 0 to 1000. Cutoffs of 900, 800, 700, etc., are used to assign letter grades of A, B, C, etc.
The spreadsheet for this course will have seven variables:
- an identifier for each student
- the number of points earned for homework
- the number of points earned for the first exam
- the number of points earned for the second exam
- the number of points earned for the final exam
- the total number of points earned
- the letter grade earned.
There are no units of measurement for student identifier and the letter grade. These are categorical variables. The student identifier is a label. The other variables are measured in “points.” Because we can do arithmetic with their values, these variables are quantitative variables.
EXAMPLE 1.4 Accounting Class Data for a Different Purpose
Suppose the data for the students in the accounting class were also to be used to study relationships between student characteristics and success in the course. For this purpose, we might want to use a data set that includes other variables such as Gender, PrevAcct (whether or not the student has taken an accounting course in high school), and Year (student classification as first, second, third, or fourth year). The label, student identifier, is a categorical variable, variables involving points are quantitative, and the remaining variables are all categorical.
In our examples of accounting class data, the possible values for the grade variable are A, B, C, D, and F. When computing grade point averages, many colleges and universities translate these letter grades into numbers using A=4, B=3, C=2, D=1, and F=0. The transformed variable with numeric values is considered to be quantitative because we can average the numerical values across different courses to obtain a grade point average.
Sometimes, experts argue about numerical scales such as this. They ask whether or not the difference between an A and a B is the same as the difference between a D and an F. Similarly, many questionnaires ask people to respond on a 1 to 5 scale, with 1 representing strongly agree, 2 representing agree, etc. Again we could ask whether or not the five possible values for this scale are equally spaced in some sense. From a practical point of view, the averages that can be computed when we convert categorical scales such as these to numerical values frequently provide a very useful way to summarize data.
Apply Your Knowledge
Question 1.4
1.4 Apartment rentals for students.
A data set lists apartments available for students to rent. Information provided includes the monthly rent, whether or not a fitness center is provided, whether or not pets are allowed, the number of bedrooms, and the distance to the campus. Describe the cases in the data set, give the number of variables, and specify whether each variable is categorical or quantitative.
instrument
Knowledge of the context of data includes an understanding of the variables that are recorded. Often, the variables in a statistical study are easy to understand: height in centimeters, study time in minutes, and so on. But each area of work also has its own special variables. A marketing research department measures consumer behavior using a scale developed for its customers. A health food store combines various types of data into a single measure that it will use to determine whether or not to put a new store in a particular location. These kinds of variables are measured with special instruments. Part of mastering your field of work is learning what variables are important and how they are best measured.
rate
Be sure that each variable really does measure what you want it to. A poor choice of variables can lead to misleading conclusions. Often, for example, the rate at which something occurs is a more meaningful measure than a simple count of occurrences.
EXAMPLE 1.5 Comparing Colleges Based on Graduates
Think about comparing colleges based on the numbers of graduates. This view tells you something about the relative sizes of different colleges. However, if you are interested in how well colleges succeed at graduating students whom they admit, it would be better to use a rate. For example, you can find data on the Internet on the six-year graduation rates of different colleges. These rates are computed by examining the progress of first-year students who enroll in a given year. Suppose that at College A there were 1000 first-year students in a particular year, and 800 graduated within six years. The graduation rate is
8001000=0.80
or 80%. College B has 2000 students who entered in the same year, and 1200 graduated within six years. The graduation rate is
12002000=0.60
or 60%. How do we compare these two colleges? College B has more graduates, but College A has a better graduation rate.
Apply Your Knowledge
Question 1.5
1.5 Which variable would you choose?
Refer to the previous example on colleges and their graduates.
- Give a setting where you would prefer to evaluate the colleges based on the numbers of graduates. Give a reason for your choice.
- Give a setting where you would prefer to evaluate the colleges based on the graduation rates. Give a reason for your choice.
1.5
(a) If you were interested in attending a large college, you would want to know the number of graduates. (b) If you were interested in making sure you graduate, you would want to know the graduation rate.
adjusting one variable to create another
In Example 1.5, when we computed the graduation rate, we used the total number of students to adjust the number of graduates. We constructed a new variable by dividing the number of graduates by the total number of students. Computing a rate is just one of several ways of adjusting one variable to create another. In Exercise 1.1 (page 3), you computed the value of the discount by subtracting the discount price from the regular price. We often divide one variable by another to compute a more meaningful variable to study.
Exercise 1.5 illustrates an important point about presenting the results of your statistical calculations. Always consider how to best communicate your results to a general audience. For example, the numbers produced by your calculator or by statistical software frequently contain more digits than are needed. Be sure that you do not include extra information generated by software that will distract from a clear explanation of what you have found.