2.4 Cautions about Correlation and Regression
Correlation and regression are powerful tools for describing the relationship between two variables. When you use these tools, you must be aware of their limitations, beginning with the fact that correlation and regression describe only linear relationships. Also remember that the correlation r and the least-squares regression line are not resistant. One influential observation or incorrectly entered data point can greatly change these measures. Always plot your data before interpreting regression or correlation. Here are some other cautions to keep in mind when you apply correlation and regression or read accounts of their use.
Extrapolation
Associations for variables can be trusted only for the range of values for which data have been collected. Even a very strong relationship may not hold outside the data's range.
EXAMPLE 2.22 Predicting the Number of Target Stores in 2008 and 2014
target
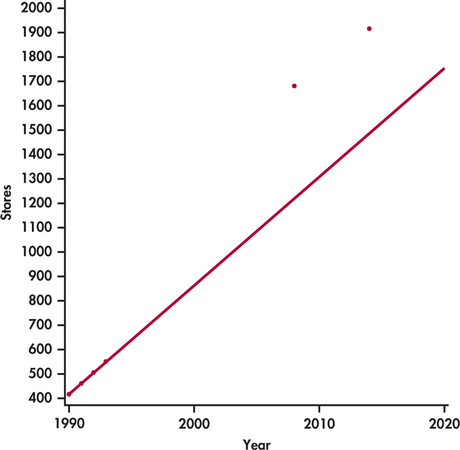
Here are data on the number of Target stores in operation at the end of each year in the early 1990s in 2008 and in 2014:12
| Year (x) | 1990 | 1991 | 1992 | 1993 | 2008 | 2014 |
| Stores (y) | 420 | 463 | 506 | 554 | 1682 | 1916 |

A plot of these data is given in Figure 2.19. The data for 1990 through 1993 lie almost exactly on a straight line, which we calculated using only the data from 1990 to 1993. The equation of this line is y=−88,136+44.5x and r2=0.9992. We know that 99.92% of the variation in stores is explained by year for these years. The equation predicts 1220 stores for 2008, but the actual number of stores is much higher, 1682. It predicts 1487 for 2014, also an underestimate by a large amount. The predictions are very poor because the very strong linear trend evident in the 1990 to 1993 data did not continue to the years 2008 and 2014.
Predictions made far beyond the range for which data have been collected can't be trusted. Few relationships are linear for all values of x. It is risky to stray far from the range of x-values that actually appear in your data.
Extrapolations
Extrapolation is the use of a regression line for prediction far outside the range of values of the explanatory variable x that you used to obtain the line. Such predictions are often not accurate.
In general, extrapolation involves using a mathematical relationship beyond the range of the data that were used to estimate the relationship. The scenario described in the previous example is typical: we try to use a least-squares relationship to make predictions for values of the explanatory variable that are much larger than the values in the data that we have. We can encounter the same difficulty when we attempt predictions for values of the explanatory variable that are much smaller than the values in the data that we have.
Careful judgment is needed when making predictions. If the prediction is for values that are within the range of the data that you have, or are not too far above or below, then your prediction can be reasonably accurate. Beyond that, you are in danger of making an inaccurate prediction.
Correlations based on averaged data
Many regression and correlation studies work with averages or other measures that combine information from many cases. You should note this carefully and resist the temptation to apply the results of such studies to individual cases. Correlations based on averages are usually higher than correlations based on individual cases. This is another reminder that it is important to note exactly what variables are measured in a statistical study.
Lurking variables
Correlation and regression describe the relationship between two variables. Often, the relationship between two variables is strongly influenced by other variables. We try to measure potentially influential variables. We can then use more advanced statistical methods to examine all the relationships revealed by our data. Sometimes, however, the relationship between two variables is influenced by other variables that we did not measure or even think about. Variables lurking in the background—measured or not—often help explain statistical associations.
Lurking Variable
A lurking variable is a variable that is not among the explanatory or response variables in a study and yet may influence the interpretation of relationships among those variables.
A lurking variable can falsely suggest a strong relationship between x and y, or it can hide a relationship that is really there. Here is an example of a negative correlation that is due to a lurking variable.
EXAMPLE 2.23 Gas and Electricity Bills
A single-family household receives bills for gas and electricity each month. The 12 observations for a recent year are plotted with the least-squares regression line in Figure 2.20. We have arbitrarily chosen to put the electricity bill on the x axis and the gas bill on the y axis. There is a clear negative association. Does this mean that a high electricity bill causes the gas bill to be low, and vice versa?
To understand the association in this example, we need to know a little more about the two variables. In this household, heating is done by gas and cooling by electricity. Therefore, in the winter months, the gas bill will be relatively high and the electricity bill will be relatively low. The pattern is reversed in the summer months. The association that we see in this example is due to a lurking variable: time of year.

Apply Your Knowledge
Question 2.77
2.77 Education and income
There is a strong positive correlation between years of education and income for economists employed by business firms. In particular, economists with a doctorate earn more than economists with only a bachelor's degree. There is also a strong positive correlation between years of education and income for economists employed by colleges and universities. But when all economists are considered, there is a negative correlation between education and income. The explanation for this is that business pays high salaries and employs mostly economists with bachelor's degrees, while colleges pay lower salaries and employ mostly economists with doctorates. Sketch a scatterplot with two groups of cases (business and academic) illustrating how a strong positive correlation within each group and a negative overall correlation can occur together.
Association is not causation
When we study the relationship between two variables, we often hope to show that changes in the explanatory variable cause changes in the response variable. But a strong association between two variables is not enough to draw conclusions about cause and effect. Sometimes, an observed association really does reflect cause and effect. Natural gas consumption in a household that uses natural gas for heating will be higher in colder months because cold weather requires burning more gas to stay warm. In other cases, an association is explained by lurking variables, and the conclusion that x causes y is either wrong or not proved. Here is an example.
EXAMPLE 2.24 Does Television Extend Life?
Measure the number of television sets per person x and the average life expectancy y for the world's nations. There is a high positive correlation: nations with many TV sets have higher life expectancies.
The basic meaning of causation is that by changing x, we can bring about a change in y. Could we lengthen the lives of people in Rwanda by shipping them TV sets? No. Rich nations have more TV sets than poor nations. Rich nations also have longer life expectancies because they offer better nutrition, clean water, and better health care. There is no cause-and-effect tie between TV sets and length of life.
Correlations such as that in Example 2.24 are sometimes called “nonsense correlations.” The correlation is real. What is nonsense is the conclusion that changing one of the variables causes changes in the other. A lurking variable—such as national wealth in Example 2.24—that influences both x and y can create a high correlation, even though there is no direct connection between x and y.
Apply Your Knowledge
Question 2.78
2.78 How's your self-esteem?
People who do well tend to feel good about themselves. Perhaps helping people feel good about themselves will help them do better in their jobs and in life. For a time, raising self-esteem became a goal in many schools and companies. Can you think of explanations for the association between high self-esteem and good performance other than “Self-esteem causes better work”?
Question 2.79
2.79 Are big hospitals bad for you?
A study shows that there is a positive correlation between the size of a hospital (measured by its number of beds x) and the median number of days y that patients remain in the hospital. Does this mean that you can shorten a hospital stay by choosing a small hospital? Why?
2.79
No, the condition of the patient is a possible lurking variable because larger hospitals likely have more resources to treat more serious injured or ill patients, which also explains why they stay longer.
Question 2.80
2.80 Do firefighters make fires worse?
Someone says, “There is a strong positive correlation between the number of firefighters at a fire and the amount of damage the fire does. So sending lots of firefighters just causes more damage.” Explain why this reasoning is wrong.
These and other examples lead us to the most important caution about correlation, regression, and statistical association between variables in general.
Association Does Not Imply Causation
An association between an explanatory variable x and a response variable y— even if it is very strong—is not, by itself, good evidence that changes in x actually cause changes in y.
experiment
The best way to get good evidence that x causes y is to do an experiment in which we change x and keep lurking variables under control. We will discuss experiments in Chapter 3. When experiments cannot be done, finding the explanation for an observed association is often difficult and controversial. Many of the sharpest disputes in which statistics plays a role involve questions of causation that cannot be settled by experiment. Does gun control reduce violent crime? Does cell phone usage cause brain tumors? Has increased free trade widened the gap between the incomes of more-educated and less-educated American workers? All of these questions have become public issues. All concern associations among variables. And all have this in common: they try to pinpoint cause and effect in a setting involving complex relations among many interacting variables.
BEYOND THE BASICS: Data Mining
Chapters 1 and 2 of this book are devoted to the important aspect of statistics called exploratory data analysis (EDA). We use graphs and numerical summaries to examine data, searching for patterns and paying attention to striking deviations from the patterns we find. In discussing regression, we advanced to using the pattern we find (in this case, a linear pattern) for prediction.
data mining
Suppose now that we have a truly enormous database, such as all purchases recorded by the cash register scanners of our retail chain during the past week. Surely this mass of data contains patterns that might guide business decisions. If we could clearly see the types of activewear preferred in large California cities and compare the preferences of small Midwest cities—right now, not at the end of the season—we might improve profits in both parts of the country by matching stock with demand. This sounds much like EDA, and indeed it is. Exploring very large databases in the hope of finding useful patterns is called data mining. Here are some distinctive features of data mining:
- When you have 100 gigabytes of data, even straightforward calculations and graphics become impossibly time-consuming. So, efficient algorithms are very important.
- The structure of the database and the process of storing the data, perhaps by unifying data scattered across many departments of a large corporation, require careful thought. The fashionable term is data warehousing.
- Data mining requires automated tools that work based on only vague queries by the user. The process is too complex to do step-by-step as we have done in EDA.
All of these features point to the need for sophisticated computer science as a basis for data mining. Indeed, data mining is often thought of as a part of computer science. Yet many statistical ideas and tools—mostly tools for dealing with multidimensional data, not the sort of thing that appears in a first statistics course—are very helpful. Like many modern developments, data mining crosses the boundaries of traditional fields of study.
Do remember that the perils we encounter with blind use of correlation and regression are yet more perilous in data mining, where the fog of an immense database prevents clear vision. Extrapolation, ignoring lurking variables, and confusing association with causation are traps for the unwary data miner.