3.3 Designing Experiments
 This page includes Video Technology Manuals
 This page includes Statistical Videos
A study is an experiment when we actually do something to people, animals, or objects in order to observe the response. Here is the basic vocabulary of experiments.
Experimental Units, Subjects, Treatment
The cases on which the experiment is done are the experimental units. When the units are human beings, they are called subjects. A specific experimental condition applied to the units is called a treatment.
Because the purpose of an experiment is to reveal the response of one variable to changes in other variables, the distinction between explanatory and response variables is important. The explanatory variables in an experiment are often called factors. Many experiments study the joint effects of several factors. In such an experiment, each treatment is formed by combining a specific value (often called a level) of each of the factors.
factors
level of a factor
EXAMPLE 3.15 Is the Cost Justified?
The increased costs for teacher salaries and facilities associated with smaller class sizes can be substantial. Are smaller classes really better? We might do an observational study that compares students who happened to be in smaller and larger classes in their early school years. Small classes are expensive, so they are more common in schools that serve richer communities. Students in small classes tend to also have other advantages: their schools have more resources, their parents are better educated, and so on. The size of the classes is confounded with other characteristics of the students, making it impossible to isolate the effects of small classes.
confounded
The Tennessee STAR program was an experiment on the effects of class size. It has been called “one of the most important educational investigations ever carried out.” The subjects were 6385 students who were beginning kindergarten. Each student was assigned to one of three treatments: regular class (22 to 25 students) with one teacher, regular class with a teacher and a full-time teacher’s aide, and small class (13 to 17 students) with one teacher. These treatments are levels of a single factor: the type of class. The students stayed in the same type of class for four years, then all returned to regular classes. In later years, students from the small classes had higher scores on standard tests, were less likely to fail a grade, had better high school grades, and so on. The benefits of small classes were greatest for minority students.20
Example 3.15 illustrates the big advantage of experiments over observational studies. In principle, experiments can give good evidence for causation. In an experiment, we study the specific factors we are interested in, while controlling the effects of lurking variables. All the students in the Tennessee STAR program followed the usual curriculum at their schools. Because students were assigned to different class types within their schools, school resources and family backgrounds were not confounded with class type. The only systematic difference was the type of class. When students from the small classes did better than those in the other two types, we can be confident that class size made the difference.
EXAMPLE 3.16 Effects of TV Advertising
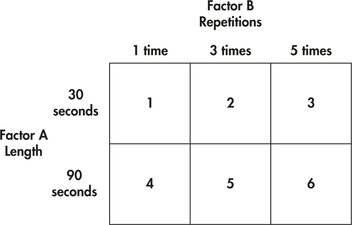
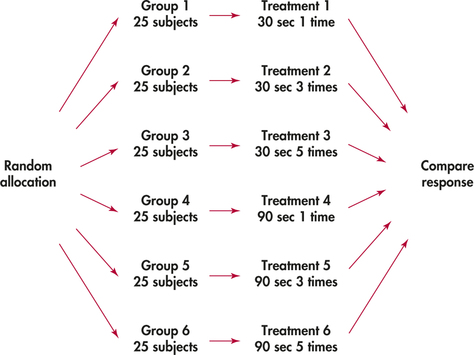
What are the effects of repeated exposure to an advertising message? The answer may depend both on the length of the ad and on how often it is repeated. An experiment investigates this question using undergraduate students as subjects. All subjects view a 40-minute television program that includes ads for a digital camera. Some subjects see a 30-second commercial; others, a 90-second version. The same commercial is repeated one, three, or five times during the program. After viewing, all of the subjects answer questions about their recall of the ad, their attitude toward the camera, and their intention to purchase it. These are the response variables.21
This experiment has two factors: length of the commercial, with two levels; and repetitions, with three levels. All possible combinations of the 2×3 factor levels form six treatment combinations. Figure 3.4 shows the layout of these treatments.
Experimentation allows us to study the effects of the specific treatments we are interested in. Moreover, we can control the environment of the subjects to hold constant the factors that are of no interest to us, such as the specific product advertised in Example 3.16. In one sense, the ideal case is a laboratory experiment in which we control all lurking variables and so see only the effect of the treatments on the response. On the other hand, the effects of being in an artificial environment such as a laboratory may also affect the outcomes. The balance between control and realism is an important consideration in the design of experiments.
Another advantage of experiments is that we can study the combined effects of several factors simultaneously. The interaction of several factors can produce effects that could not be predicted from looking at the effect of each factor alone. Perhaps longer commercials increase interest in a product, and more commercials also increase interest, but if we make a commercial longer and show it more often, viewers get annoyed and their interest in the product drops. The two-factor experiment in Example 3.16 will help us find out.
Apply Your Knowledge
Question 3.42
3.42 Radiation and storage time for food products.
Storing food for long periods of time is a major challenge for those planning for human space travel beyond the moon. One problem is that exposure to radiation decreases the length of time that food can be stored. One experiment examined the effects of nine different levels of radiation on a particular type of fat, or lipid.22 The amount of oxidation of the lipid is the measure of the extent of the damage due to the radiation. Three samples are exposed to each radiation level. Give the experimental units, the treatments, and the response variable. Describe the factor and its levels. There are many different types of lipids. To what extent do you think the results of this experiment can be generalized to other lipids?
Question 3.43
3.43 Can they use the Web?
A course in computer graphics technology requires students to learn multiview drawing concepts. This topic is traditionally taught using supplementary material printed on paper. The instructor of the course believes that a web-based interactive drawing program will be more effective in increasing the drawing skills of the students.23 The 50 students who are enrolled in the course will be randomly assigned to either the paper-based instruction or the web-based instruction. A standardized drawing test will be given before and after the instruction. Explain why this study is an experiment, and give the experimental units, the treatments, and the response variable. Describe the factor and its levels. To what extent do you think the results of this experiment can be generalized to other settings?
3.43
It is an experiment because the instructor has assigned the students to one of two instructional methods (paper-based or web-based). The experimental units are students. The treatments are type of instruction, paper-based and web-based. The response is the change in standardized drawing test (pre vs. post). The factor is the instructional method, with levels paper-based and web-based. The results would likely not be widely generalizable because the students were all in the same course but could probably be generalized to the same or similar courses in computer graphics technology.
Question 3.44
3.44 Is the packaging convenient for the customer?
A manufacturer of food products uses package liners that are sealed by applying heated jaws after the package is filled. The customer peels the sealed pieces apart to open the package. What effect does the temperature of the jaws have on the force needed to peel the liner? To answer this question, engineers prepare 20 package liners. They seal five liners at each of four different temperatures: 250°F, 275°F, 300°F, and 325°F. Then they measure the force needed to peel each seal.
- What are the experimental units studied?
- There is one factor (explanatory variable). What is it, and what are its levels?
- What is the response variable?
Comparative experiments
Many experiments have a simple design with only a single treatment, which is applied to all experimental units. The design of such an experiment can be outlined as
Treatment→Observe response
EXAMPLE 3.17 Increase the Sales Force
A company may increase its sales force in the hope that sales will increase. The company compares sales before the increase with sales after the increase. Sales are up, so the manager who suggested the change gets a bonus.
Increase the sales force→Observe sales
The sales experiment of Exercise 3.17 was poorly designed to evaluate the effect of increasing the sales force. Perhaps sales increased because of seasonal variation in demand or other factors affecting the business.
In medical settings, an improvement in condition is sometimes due to a phenomenon called the placebo effect. In medicine, a placebo is a dummy or fake treatment, such as a sugar pill. Many participants, regardless of treatment, respond favorably to personal attention or to the expectation that the treatment will help them.
placebo effect
For the sales force study, we don’t know whether the increase in sales was due to increasing the sales force or to other factors. The experiment gave in conclusive results because the effect of increasing the sales force was confounded with other factors that could have had an effect on sales. The best way to avoid confounding is to do a comparative experiment. Think about a study where the sales force is increased in half of the regions where the product is sold and is not changed in the other regions. A comparison of sales from the two sets of regions would provide an evaluation of the effect of the increasing the sales force.
comparative experiment
In medical settings, it is standard practice to randomly assign patients to either a control group or a treatment group. All patients are treated the same in every way except that the treatment group receives the treatment that is being evaluated. In the setting of our comparative sales experiment, we would randomly divide the regions into two groups. One group will have the sales force increased and the other group will not.
control group
treatment group

Uncontrolled experiments in medicine and the behavioral sciences can be dominated by such influences as the details of the experimental arrangement, the selection of subjects, and the placebo effect. The result is often bias.
An uncontrolled study of a new medical therapy, for example, is biased in favor of finding the treatment effective because of the placebo effect. It should not surprise you to learn that uncontrolled studies in medicine give new therapies a much higher success rate than proper comparative experiments do. Well-designed experiments usually compare several treatments.
Apply Your Knowledge
Question 3.45
3.45 Does using statistical software improve exam scores?
An instructor in an elementary statistics course wants to know if using a new statistical software package will improve students’ final-exam scores. He asks for volunteers, and approximately half of the class agrees to work with the new software. He compares the final-exam scores of the students who used the new software with the scores of those who did not. Discuss possible sources of bias in this study.
3.45
For those students who volunteered, they could have attributes that lead them to volunteer and also do better on the final. For example, they might be more willing to work hard or might enjoy studying, which may make them more willing to agree to use the new software and also do better on the final.
Randomized comparative experiments
experiment design
The design of an experiment first describes the response variables, the factors(explanatory variables), and the layout of the treatments, with comparison as the leading principle. The second aspect of design is the rule used to assign the subjects to the treatments. Comparison of the effects of several treatments is valid only when all treatments are applied to similar groups of subjects. If one corn variety is planted on more fertile ground, or if one cancer drug is given to less seriously ill patients, comparisons among treatments are biased. How can we assign cases to treatments in a way that is fair to all the treatments?
Our answer is the same as in sampling: let impersonal chance make the assignment. The use of chance to divide subjects into groups is called randomization. Groups formed by randomization don’t depend on any characteristic of the subjects or on the judgment of the experimenter. An experiment that uses both comparison and randomization is a randomized comparative experiment. Here is an example.
randomization
randomized comparative experiment
EXAMPLE 3.18 Testing a Breakfast Food
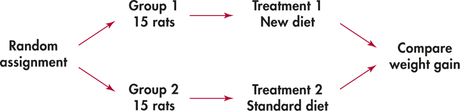
A food company assesses the nutritional quality of a new “instant breakfast” product by feeding it to newly weaned male white rats. The response variable is a rat’s weight gain over a 28-day period. A control group of rats eats a standard diet but otherwise receives exactly the same treatment as the experimental group.
This experiment has one factor (the diet) with two levels. The researchers use30 rats for the experiment and so divide them into two groups of 15. To do this in an unbiased fashion, put the cage numbers of the 30 rats in a hat, mix them up, and draw 15. These rats form the experimental group and the remaining 15 make up the control group. Each group is an SRS of the available rats. Figure 3.5 outlines the design of this experiment.
Apply Your Knowledge
Question 3.46
3.46 Diagram the food storage experiment.
Refer to Exercise 3.42 (page 144). Draw a diagram similar to Figure 3.5 that describes the food for space travel experiment.
Question 3.47
3.47 Diagram the Web use.
Refer to Exercise 3.43 (page 144). Draw a diagram similar to Figure 3.5 that describes the computer graphics drawing experiment.
Completely randomized designs
The design in Figure 3.5 combines comparison and randomization to arrive at the simplest statistical design for an experiment. This “flowchart” outline presents all the essentials: randomization, the sizes of the groups and which treatment they receive, and the response variable. There are, as we will see later, statistical reasons for generally using treatment groups that are approximately equal in size. We call designs like that in Figure 3.5 completely randomized.
Completely Randomized Design
In a completely randomized experimental design, all the subjects are allocated at random among all the treatments.
Completely randomized designs can compare any number of treatments. Here is an example that compares three treatments.
EXAMPLE 3.19 Utility Companies and Energy Conservation
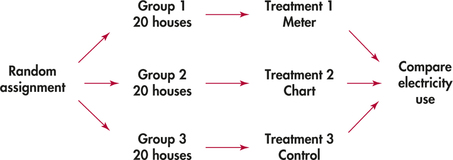
Many utility companies have introduced programs to encourage energy conservation among their customers. An electric company considers placing electronic meters in households to show what the cost would be if the electricity use at that moment continued for a month. Will these meters reduce electricity use? Would cheaper methods work almost as well? The company decides to design an experiment.
One cheaper approach is to give customers a chart and information about monitoring their electricity use. The experiment compares these two approaches (meter, chart) and also a control. The control group of customers receives information about energy conservation but no help in monitoring electricity use. The response variable is total electricity used in a year. The company finds 60 single-family residences in the same city willing to participate, so it assigns 20 residences at random to each of the three treatments. Figure 3.6 outlines the design.
How to randomize
The idea of randomization is to assign experimental units to treatments by drawing names from a hat. In practice, experimenters use software to carry out randomization. In Example 3.19, we have 60 residences that need to be randomly assigned to three treatments. Most statistical software will be able to do the randomization required.
We prefer to use software for randomizing but if you do not have that option available to you, a table of random digits, such as Table B can be used. Using software, the method is similar to what we used to select an SRS in Example 3.9(page 133). Here are the steps needed:
Step 1: Label. Give each experimental unit a unique label. For privacy reasons, we might want to use a numerical label and a keep a file that identifies the experimental units with the number in a separate place.
Step 2: Use the computer. Once we have the labels, we create a data file with the labels and generate a random number for each label. In Excel, this can be done with the RAND() function. Finally, we sort the entire data set based on the random numbers. Groups are formed by selecting units in order from the sorted list.
EXAMPLE 3.20 Do the Randomization for the Utility Company Experiment Using Excel
In the utility company experiment of Example 3.19, we must assign 60 residences to three treatments. First we generate the labels. Let’s use numerical labels and keep a separate file that gives the residence address for each number. So for Step 1, we will use these labels, 1 to 60:
1,2,3,...,59,60
To illustrate Step 2, we will show several Excel files. To see what we are doing, it will be easier if we reduce the number of residences to be randomized. So, let’s randomize 12 residences to the three treatments. Our labels are
1,2,3,4,5,6,7,8,9,10,11,12
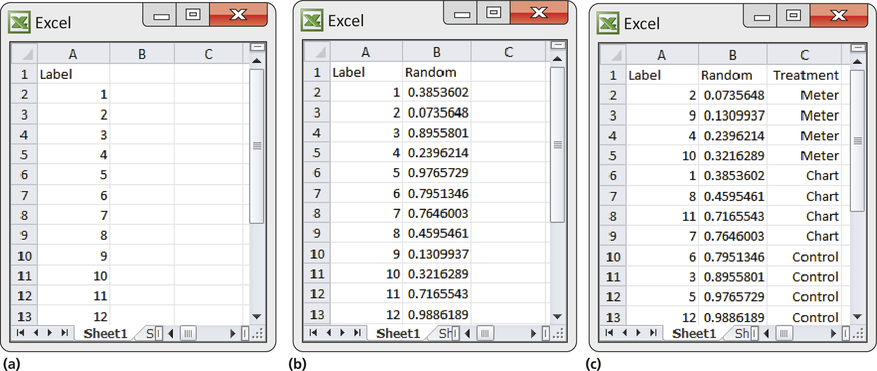
For the first part of Step 2, we create an Excel file with the numbers 1 to 12 in the first column. This file is shown in Figure 3.7(a). Next, we use the RAND() function in Excel to generate 12 random numbers in the second column. The result is shown in Figure 3.7(b). We then sort the file based in the random numbers. We create a third column with the following treatments: “Meter” for the first four, “Chart” for the next four, and “Control” for the last four. The result is displayed in Figure 3.7(c).
If software is not available, you can use the random digits in Table B to do the randomization. The method is similar to the one we used to select an SRS in Example 3.8 (page 133). Here are the steps that you need:
Step 1: Label. Give each experimental unit a numerical label. Each label must contain the same number of digits. So, for example, if you are randomizing 10 experimental units, you could use the labels, 0, 1, … , 8, 9; or 01, 02, … , 10. Note that with the first choice you need only one digit, but for the second choice, you need two.
Step 2: Table. Start anywhere in Table B and read digits in groups corresponding to one-digit or two-digit groups. (You really do not want to use Table B for more than100 experimental units. Software is needed here.)
EXAMPLE 3.21 Do the Randomization for the Utility Company Experiment Using Random Digits
As we did in Example 3.20, we will illustrate the method by randomizing 12 residences to three treatments. For Step 1, we assign the 12 residences the following labels:
01,02,03,04,05,06,07,08,09,10,11,12
Compare these labels with the ones we used in Example 3.20. Here, we need the same number of digits for each label, so we put a zero as the first digit for the first nine labels.
For Step 2, we will use Table B starting at line 118. Here are the table entries for that line:
| 73190 | 32533 | 04470 | 29669 | 84407 | 90785 | 65956 | 86382 |
To make our work a little easier, we rewrite these digits in pairs:
| 73 | 19 | 03 | 25 | 33 | 04 | 47 | 02 | 96 | 69 | 84 | 40 | 79 | 07 | 85 | 65 | 95 | 68 | 63 | 82 |
We now select the labels for the first treatment, “Meter.” Reading pairs of digits from left to write and ignoring pairs that do not correspond to any of our labels, we see the labels 03, 04, 02, and 07. The corresponding residences will receive the “Meter” treatment. We will continue the process to find four labels to be assigned to the “Chart” treatment. We continue to the next line in Table B, where we do not find any labels between 01 and 12. On line 120, we have the label 04. This label has already been assigned to a treatment so we ignore it. Line121 has two labels between 01 and 12: 07, which has already been assigned to a treatment, and 10, which we assign to “Chart.” On the next line, we have 05, 09,and 08 which we also assign to “Chart.” The remaining four labels are assigned to the “Control” treatment. In summary, 02, 03, 04, and 07 are assigned to “Meter,”05, 08, 09, and 10 are assigned to “Chart,” and 01, 06, 11, and 12 are assigned to “Control.”

As Example 3.21 illustrates, randomization requires two steps: assign labels to the experimental units and then use Table B to select labels at random. Be surethat all labels are the same length so that all have the same chance to be chosen. You can read digits from Table B in any order—along a row, down a column, and so on—because the table has no order. As an easy standard practice, we recommend reading along rows. In Example 3.21, we needed 180 random digits from four and a half lines (118 to 121 and half of 122) to complete the randomization. If we wanted to reduce this amount, we could use more than one label for each residence. For example, we could use labels 01, 21, 41, 61, and 81 for the first residence; 02, 22,42, 62, and 82 for the second residence; and so forth.
Examples 3.18 and 3.19 describe completely randomized designs that compare levels of a single factor. In Example 3.18, the factor is the diet fed to the rats. In Example 3.19, it is the method used to encourage energy conservation. Completely randomized designs can have more than one factor. The advertising experiment of Example 3.16 has two factors: the length and the number of repetitions of a television commercial. Their combinations form the six treatments outlined in Figure 3.4 (page 144). A completely randomized design assigns subjects at random to these six treatments. Once the layout of treatments is set, the randomization needed for a completely randomized design is tedious but straight forward.
Apply Your Knowledge
Question 3.48
3.48 Does child care help recruit employees?
ccare
Will providing child care for employees make a company more attractive to women? You are designing an experiment to answer this question. You prepare recruiting material for two fictitious companies, both in similar businesses in the same location. Company A’s brochure does not mention child care. There are two versions of Company B’s brochure. One is identical to Company A’s brochure. The other is also the same, but a description of the company’s onsite child care facility is included. Your subjects are 40 women who are college seniors seeking employment. Each subject will read recruiting material for Company A and one of the versions of the recruiting material for Company B. You will give each version of Company B’s brochure to half the women. After reading the material for both companies, each subject chooses the one she would prefer to work for. You expect that a higher percent of those who read the description that includes child care will choose Company B.
- Outline an appropriate design for the experiment.
- The names of the subjects appear below. Use software or Table B, beginning at line 112, to do the randomization required by your design. List the subjects who will read the version that mentions child care.
| Abrams | Danielson | Gutierrez | Lippman | Rosen |
| Adamson | Durr | Howard | Martinez | Sugiwara |
| Afifi | Edwards | Hwang | McNeill | Thompson |
| Brown | Fluharty | Iselin | Morse | Travers |
| Cansico | Garcia | Janle | Ng | Turing |
| Chen | Gerson | Kaplan | Quinones | Ullmann |
| Cortez | Green | Kim | Rivera | Williams |
| Curzakis | Gupta | Lattimore | Roberts | Wong |
Question 3.49
3.49 Sealing food packages.
Use a diagram to describe a completely randomized experimental design for the package liner experiment of Exercise 3.44 (page 145).(Show the size of the groups, the treatment each group receives, and the response variable. Figures 3.5 and 3.6 are models to follow.) Use software or Table B, starting at line 140, to do the randomization required by your design.
3.49
Using labels 01–40 and line 140 the assignments are:
- Group 1: 12, 13, 04, 18, 19
- Group 2: 16, 02, 08, 17, 10
- Group 3: 05, 09, 06, 01, 20
- Group 4: 03, 07, 11, 14, 15
The logic of randomized comparative experiments
Randomized comparative experiments are designed to give good evidence that differences in the treatments actually cause the differences we see in the response. The logic is as follows:
- Random assignment of subjects forms groups that should be similar in all respects before the treatments are applied.
- Comparative design ensures that influences other than the experimental treatments operate equally on all groups.
- Therefore, differences in average response must be due either to the treatments or to the play of chance in the random assignment of subjects to the treatments.
That “either-or” deserves more thought. In Example 3.18 (page 146), we cannot say that any difference in the average weight gains of rats fed the two diets must be caused by a difference between the diets. There would be some difference even if both groups received the same diet because the natural variability among rats means that some grow faster than others. If chance assigns the faster-growing rats to one group or the other, this creates a chance difference between the groups. We would not trust an experiment with just one rat in each group, for example. The results would depend on which group got lucky and received the faster-growing rat. If we assign many rats to each diet, however, the effects of chance will average out, and there will be little difference in the average weight gains in the two groups unless the diets themselves cause a difference. “Use enough subjects to reduce chance variation” is the third big idea of statistical design of experiments.
Principles of Experimental Design
- Compare two or more treatments. This will control the effects of lurking variables on the response.
- Randomize—use chance to assign subjects to treatments.
- Replicate each treatment on enough subjects to reduce chance variation in the results.
EXAMPLE 3.22 Cell Phones and Driving

Does talking on a hands-free cell phone distract drivers? Undergraduate students “drove” in a high-fidelity driving simulator equipped with a hands-free cell phone. The car ahead brakes: how quickly does the subject respond? Twenty students (the control group) simply drove. Another 20 (the experimental group) talked on the cellphone while driving. The simulator gave the same driving conditions to both groups.24
This experimental design has good control because the only difference in the conditions for the two groups is the use of the cell phone. Students are randomized to the two groups, so we satisfy the second principle. Based on past experience with the simulators, the length of the drive and the number of subjects were judged to provide sufficient information to make the comparison. (We learn more about choosing sample sizes for experiments in starting Chapter 7.)
We hope to see a difference in the responses so large that it is unlikely to happen just because of chance variation. We can use the laws of probability, which give a mathematical description of chance behavior, to learn if the treatment effects are larger than we would expect to see if only chance were operating. If they are, we call them statistically significant.
statistically significant
Statistical Significance
An observed effect so large that it would rarely occur by chance is called statistically significant.
If we observe statistically significant differences among the groups in a comparative randomized experiment, we have good evidence that the treatments actually caused these differences. You will often see the phrase “statistically significant” in reports of investigations in many fields of study. The great advantage of randomized comparative experiments is that they can produce data that give good evidence for a cause-and-effect relationship between the explanatory and response variables. We know that, in general, a strong association does not imply causation. A statistically significant association in data from a well-designed experiment does imply causation.
Apply Your Knowledge
Question 3.50
3.50 Utility companies.
Example 3.19 (page 147) describes an experiment to learn whether providing households with electronic meters or charts will reduce their electricity consumption. An executive of the utility company objects to including a control group. He says, “It would be simpler to just compare electricity use last year (before the meter or chart was provided) with consumption in the same period this year. If households use less electricity this year, the meter or chart must be working.” Explain clearly why this design is inferior to that in Example 3.19.
Question 3.51
3.51 Statistical significance.
The financial aid office of a university asks a sample of students about their employment and earnings. The report says that “for academic year earnings, a significant difference was found between the sexes, with men earning more on the average. No significant difference was found between the earnings of black and white students.” Explain the meaning of “a significant difference” and “no significant difference” in plain language.
3.51
“A significant difference” means that the difference found between the sexes is unlikely to have occurred by chance alone and that sex is likely a contributor to the difference found in earnings. “No significant difference” means that the difference between black and white students is small enough that it is likely due to just chance. Whichever group happens to have more or less earnings, the difference is not due to race.
Completely randomized designs can compare any number of treatments. The treatments can be formed by levels of a single factor or by more than one factor. Here is an example with two factors.
EXAMPLE 3.23 Randomization for the TV Commercial Experiment
Figure 3.4 (page 144) displays six treatments formed by the two factors in an experiment on response to a TV commercial. Suppose that we have 150 students who are willing to serve as subjects. We must assign 25 students at random to each group. Figure 3.8 outlines the completely randomized design.
To carry out the random assignment, label the 150 students 001 to 150. (Three digits are needed to label 150 subjects.) Enter Table B and read three-digit groups until you have selected 25 students to receive Treatment 1 (a 30-second ad shown once). If you start at line 140, the first few labels for Treatment 1 subjects are 129, 048, and 003.
Continue in Table B to select 25 more students to receive Treatment 2 (a 30-second ad shown three times). Then select another 25 for Treatment 3 and so on until you have assigned 125 of the 150 students to Treatments 1 through 5. The 25 students who remain get Treatment 6. The randomization is straightforward but very tedious to do by hand. We recommend software such as the Simple Random Sample applet. Exercise 3.62 (page 158) shows how to use the applet to do the randomization for this example.

Apply Your Knowledge
Question 3.52
3.52 Do the randomization.
Use computer software to carry out the randomization in Example 3.23.
Cautions about experimentation
The logic of a randomized comparative experiment depends on our ability to treat all the subjects identically in every way except for the actual treatments being compared. Good experiments therefore require careful attention to details.
Many—perhaps most—experiments have some weaknesses in detail. The environment of an experiment can influence the outcomes in unexpected ways. Although experiments are the gold standard for evidence of cause and effect, really convincing evidence usually requires that a number of studies in different places with different details produce similar results. The most serious potential weakness of experiments is lack of realism. The subjects or treatments or setting of an experiment may not realistically duplicate the conditions we really want to study. Here are two examples.
lack of realism
EXAMPLE 3.24 Layoffs and Feeling Bad
How do layoffs at a workplace affect the workers who remain on the job? Psychologists asked student subjects to proofread text for extra course credit, then “let go” some of the workers (who were actually accomplices of the experimenters). Some subjects were told that those let go had performed poorly (Treatment 1). Others were told that not all could be kept and that it was just luck that they were kept and others let go (Treatment 2). We can’t be sure that the reactions of the students are the same as those of workers who survive a layoff in which other workers lose their jobs. Many behavioral science experiments use student subjects in a campus setting. Do the conclusions apply to the real world?
EXAMPLE 3.25 Does the Regulation Make the Product Safer?
Do those high center brake lights, required on all cars sold in the United States since 1986, really reduce rear-end collisions? Randomized comparative experiments with fleets of rental and business cars, done before the lights were required, showed that the third brake light reduced rear-end collisions by as much as 50%. Unfortunately, requiring the third light in all cars led to only a 5% drop.
What happened? Most cars did not have the extra brake light when the experiments were carried out, so it caught the eye of following drivers. Now that almost all cars have the third light, they no longer capture attention.
Lack of realism can limit our ability to apply the conclusions of an experiment to the settings of greatest interest. Most experimenters want to generalize their conclusions to some setting wider than that of the actual experiment. Statistical analysis of the original experiment cannot tell us how far the results will generalize. Nonetheless, the randomized comparative experiment, because of its ability to give convincing evidence for causation, is one of the most important ideas in statistics.
Apply Your Knowledge
Question 3.53
3.53 Managers and stress.
Some companies employ consultants to train their managers in meditation in the hope that this practice will relieve stress and make the managers more effective on the job. An experiment that claimed to show that meditation reduces anxiety proceeded as follows. The experimenter interviewed the subjects and rated their level of anxiety. Then the subjects were randomly assigned to two groups. The experimenter taught one group how to meditate, and they meditated daily for a month. The other group was simply told to relax more. At the end of the month, the experimenter interviewed all the subjects again and rated their anxiety level. The meditation group now had less anxiety. Psychologists said that the results were suspect because the ratings were not blind—that is, the experimenter knew which treatment each subject received. Explain what this means and how lack of blindness could bias the reported results.
3.53
Because the experimenter measured their anxiety and also taught the group how to meditate, the experimenter could biasedly rate the group that meditated lower or higher in anxiety based on their expectation of whether the meditation would help or not. Also, separate from the experimenter’s possible bias, the subjects themselves could behave more or less anxiously during the final evaluation based on their interaction with the experimenter during the meditation instruction, which could also bias the results.
Question 3.54
3.54 Frustration and teamwork.
A psychologist wants to study the effects of failure and frustration on the relationships among members of a work team. She forms a team of students, brings them to the psychology laboratory, and has them play a game that requires teamwork. The game is rigged so that they lose regularly. The psychologist observes the students through a one-way window and notes the changes in their behavior during an evening of game playing. Why is it doubtful that the findings of this study tell us much about the effect of working for months developing a new product that never works right and is finally abandoned by your company?
Matched pairs designs
Completely randomized designs are the simplest statistical designs for experiments. They illustrate clearly the principles of control, randomization, and replication of treatments on a number of subjects. However, completely randomized designs are often inferior to more elaborate statistical designs. In particular, matching the subjects in various ways can produce more precise results than simple randomization.
matched pairs design
One common design that combines matching with randomization is the matched pairs design. A matched pairs design compares just two treatments. Choose pairs of subjects that are as closely matched as possible. Assign one of the treatments to each subject in a pair by tossing a coin or reading odd and even digits from Table B. Sometimes, each “pair” in a matched pairs design consists of just one subject, who gets both treatments one after the other. Each subject serves as his or her own control. The order of the treatments can influence the subject’s response, so we randomize the order for each subject, again by a coin toss.
EXAMPLE 3.26 Matched Pairs for the Cell Phone Experiment
Example 3.22 (page 151) describes an experiment on the effects of talking on a cell phone while driving. The experiment compared two treatments: driving in a simulator and driving in a simulator while talking on a hands-free cell phone. The response variable is the time the driver takes to apply the brake when the car in front brakes suddenly. In Example 3.22, 40 student subjects were assigned at random, 20 students to each treatment. Subjects differ in driving skill and reaction times. The completely randomized design relies on chance to create two similar groups of subjects.
In fact, the experimenters used a matched pairs design in which all subjects drove under both conditions. They compared each subject’s reaction times with and without the phone. If all subjects drove first with the phone and then without it, the effect of talking on the cell phone would be confounded with the fact that this is the first run in the simulator. The proper procedure requires that all subjects first be trained in using the simulator, that the order in which a subject drives with and without the phone be random, and that the two drives be on separate days to reduce the chance that the results of the second treatment will be affected by the first treatment.
The completely randomized design uses chance to decide which 20 subjects will drive with the cell phone. The other 20 drive without it. The matched pairs design uses chance to decide which 20 subjects will drive first with and then without the cell phone. The other 20 drive first without and then with the phone.
Block designs
Matched pairs designs apply the principles of comparison of treatments, randomization, and replication. However, the randomization is not complete—we do not randomly assign all the subjects at once to the two treatments. Instead, we only randomize within each matched pair. This allows matching to reduce the effect of variation among the subjects. Matched pairs are an example of block designs.
Block Design
A block is a group of subjects that are known before the experiment to be similar in some way expected to affect the response to the treatments. In a block design, the random assignment of individuals to treatments is carried out separately within each block.
A block design combines the idea of creating equivalent treatment groups by matching with the principle of forming treatment groups at random. Here is a typical example of a block design.
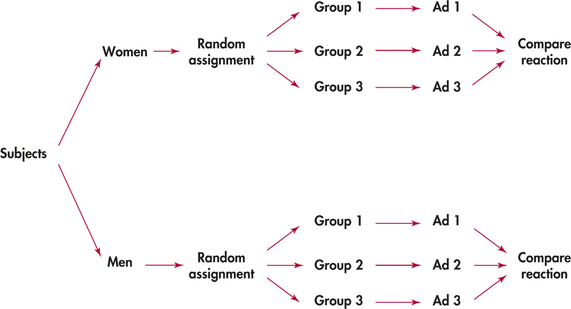
EXAMPLE 3.27 Men, Women, and Advertising
An experiment to compare the effectiveness of three television commercials for the same product will want to look separately at the reactions of men and women, as well as assess the overall response to the ads.
A completely randomized design considers all subjects, both men and women, as a single pool. The randomization assigns subjects to three treatment groups without regard to their gender. This ignores the differences between men and women. A better design considers women and men separately. Randomly assign the women to three groups, one to view each commercial. Then separately assign the men at random to three groups. Figure 3.9 outlines this improved design.
A block is a group of subjects formed before an experiment starts. We reserve the word “treatment” for a condition that we impose on the subjects. We don’t speak of six treatments in Example 3.29 even though we can compare the responses of six groups of subjects formed by the two blocks (men, women) and the three commercials. Block designs are similar to stratified samples. Blocks and strata both group similar individuals together. We use two different names only because the idea developed separately for sampling and experiments.
Blocks are another form of control. They control the effects of some outside variables by bringing those variables into the experiment to form the blocks. The advantages of block designs are the same as the advantages of stratified samples. Blocks allow us to draw separate conclusions about each block—for example, about men and women in the advertising study in Example 3.27. Blocking also allows more precise overall conclusions because the systematic differences between men and women can be removed when we study the overall effects of the three commercials.
The idea of blocking is an important additional principle of statistical design of experiments. A wise experimenter will form blocks based on the most important unavoidable sources of variability among the experimental subjects. Randomization will then average out the effects of the remaining variation and allow an unbiased comparison of the treatments.
Like the design of samples, the design of complex experiments is a job for experts. Now that we have seen a bit of what is involved, we will usually just act as if most experiments were completely randomized.
Apply Your Knowledge
Question 3.55
3.55 Does charting help investors?
Some investment advisers believe that charts of past trends in the prices of securities can help predict future prices. Most economists disagree. In an experiment to examine the effects of using charts, business students trade (hypothetically) a foreign currency at computer screens. There are 20 student subjects available, named for convenience A, B, C, … , T. Their goal is to make as much money as possible, and the best performances are rewarded with small prizes. The student traders have the price history of the foreign currency in dollars in their computers. They may or may not also have software that highlights trends. Describe two designs for this experiment—a completely randomized design and a matched pairs design in which each student serves as his or her own control. In both cases, carry out the randomization required by the design.
3.55
In a completely randomized design: 10 students each are randomly assigned to two groups, then one group is randomly assigned the software that highlights trends, the other receives the regular software, and at the end you compare the money made by the two groups. In a matched pairs design: each student uses both types of software in random order for half the time, then the difference between the money made with and without the trend highlights is compared.