6.4 Using Significance Tests
 This page includes Statistical Videos
Carrying out a test of significance is often quite simple, especially if the P-value is given effortlessly by a computer. Using tests wisely is not so simple. Each test is valid only in certain circumstances, with properly produced data being particularly important.
The z test, for example, should bear the same warning label that was attached in Section 6.2 to the corresponding confidence interval (page 311). Similar warnings accompany the other tests that we will learn. There are additional caveats that concern tests more than confidence intervals—enough to warrant this separate section. Some hesitation about the unthinking use of significance tests is a sign of statistical maturity.
The reasoning of significance tests has appealed to researchers in many fields so that tests are widely used to report research results. In this setting, Ha is a “research hypothesis” asserting that some effect or difference is present. The null hypothesis H0 says that there is no effect or no difference. A low P-value represents good evidence that the research hypothesis is true. Here are some comments on the use of significance tests, with emphasis on their use in reporting scientifc research.
Choosing a level of significance
The spirit of a test of significance is to give a clear statement of the degree of evidence provided by the sample against the null hypothesis. The P-value does this. It is common practice to report P-values and to describe results as statistically signifcant whenever P≤0.05. However, there is no sharp border between “signifcant” and “not signifcant,” only increasingly strong evidence as the P-value decreases. Having both the P-value and the statement that we reject or fail to reject H0 allows us to draw better conclusions from our data.

EXAMPLE 6.22 Information Provided by the P-Value
Suppose that the test statistic for a two-sided significance test for a population mean is z=1.95. From Table A, we can calculate the P-value. It is
P=2[1−P(Z≤1.95)]=2(1−0.9744)=0.0512
We have failed to meet the standard of evidence for α=0.05. However, with the information provided by the P-value, we can see that the result just barely missed the standard. If the effect in question is interesting and potentially important, we might want to design another study with a larger sample to investigate it further.
Here is another example in which the P-value provides useful information beyond that provided by the statement that we reject or fail to reject the null hypothesis.
EXAMPLE 6.23 More on Information Provided by the P-Value
We have a test statistic of z=-4.66 for a two-sided significance test on a population mean. Software tells us that the P-value is 0.000003. This means that there are three chances in 1,000,000 of observing a sample mean this far or farther away from the null hypothesized value of μ. This kind of event is virtually impossible if the null hypothesis is true. There is no ambiguity in the result; we can clearly reject the null hypothesis.
We frequently report small P-values such as that in the previous example as P<0.001. This corresponds to a chance of one in 1000 and is sufficiently small to lead us to a clear rejection of the null hypothesis.
One reason for the common use of α=0.05 is the great influence of Sir R. A. Fisher, the inventor of formal statistical methods for analyzing experimental data. Here is his opinion on choosing a level of significance: “A scientifc fact should be regarded as experimentally established only if a properly designed experiment rarely fails to give this level of significance.”20
What statistical significance does not mean
When a null hypothesis (“no effect” or “no difference”) can be rejected at the usual level α=0.05, there is good evidence that an effect is present. That effect, however, can be extremely small. When large samples are available, even tiny deviations from the null hypothesis will be signifcant.
EXAMPLE 6.24 It’s Signifcant But Is It Important?
Suppose that we are testing the hypothesis of no correlation between two variables. With 400 observations, an observed correlation of only r=0.1 is signifcant evidence at the α=0.05 level that the correlation in the population is not zero. Figure 6.17 is an example of 400 (x, y) pairs that have an observed correlation of 0.10. For these data, the P-value for testing the null hypothesis of no correlation is 0.03. The small P-value does not mean that there is a strong association, only that there is evidence of some association.
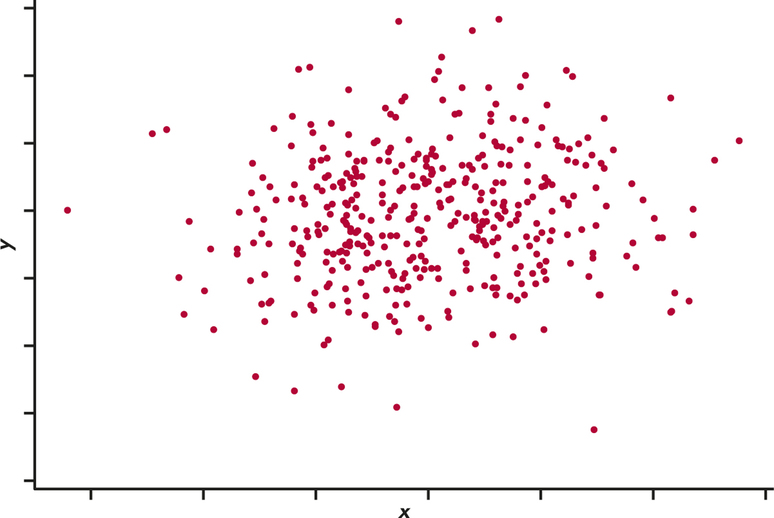
For practical purposes, we might well decide to ignore this association. Statistical significance is not the same as practical significance. The remedy for attaching too much importance to statistical significance is to pay attention to the actual experimental results as well as to the P-value. Plot your data and examine them carefully. Beware of outliers. A few outlying observations can produce signif-cant results if you blindly apply common tests of significance. Outliers can also destroy the significance of otherwise-convincing data. The foolish user of statistics who feeds the data to a computer without exploratory analysis will often be embarrassed.
Is the effect that you are seeking visible in your plots? If not, ask yourself how the effect can be of practical importance if it is not large enough to even be seen. Even if the effect is visible, you can still ask yourself if it is large enough to be of practical importance. In either case, remember that what is considered large enough is application dependent. It may be that detection of tiny deviations is of great practical importance. For example, in many of today’s manufacturing environments, parts are produced to very exacting tolerances with the minutest of deviations (for example, ten-thousandths of a millimeter) resulting in defective product. It is usually wise to give a confidence interval for the parameter in which you are interested. A confidence interval actually estimates the size of an effect rather than simply asking if it is too large to reasonably occur by chance alone. At which point, understanding and background knowledge of the practical application will guide you to assess whether the estimated effect size is important enough for action. Confidence intervals are not used as often as they should be, while tests of significance are perhaps overused.
Apply Your Knowledge
Question 6.93
6.93 Is it signifcant?
More than 200,000 people worldwide take the GMAT examination each year when they apply for MBA programs. Their scores vary Normally with mean about μ=525 and standard deviation about σ=100. One hundred students go through a rigorous training program designed to raise their GMAT scores. Test the following hypotheses about the training program
H0:μ=525Ha:μ>525
in each of the following situations.
- The students’ average score is ˉx=541.4. Is this result signifcant at the 5% level?
- Now suppose that the average score is ˉx=541.5. Is this result signifcant at the 5% level?
- Explain how you would reconcile this difference in significance, especially if any increase greater than 15 points is considered a success.
6.93
(a) No. (b) Yes. (c) Even though the first result is not statistically significant, we would still consider it of practical significance because it is more than a 15-point improvement.
Statistical inference is not valid for all sets of data
In Chapter 3, we learned that badly designed surveys or experiments often produce invalid results. Formal statistical inference cannot correct basic faws in the design.

Tests of significance and confidence intervals are based on the laws of probability. Randomization in sampling or experimentation ensures that these laws apply. But we must often analyze data that do not arise from randomized samples or experiments. To apply statistical inference to such data, we must have confidence in a probability model for the data. The diameters of successive holes bored in auto engine blocks during production, for example, may behave like independent observations from a Normal distribution. We can check this probability model by examining the data. If the Normal distribution model appears correct, we can apply the methods of this chapter to do inference about the process mean diameter μ. Do ask how the data were produced, and don’t be too impressed by P-values on a printout until you are confident that the data deserve a formal analysis.
Apply Your Knowledge
Question 6.94
6.94 Student satisfaction.
Each year Forbes publishes its rankings of 650 American colleges. The category of student satisfaction carries a weight of 25% toward the overall score of a college. The major component of the student satisfaction measure is based on student evaluations from RateMyProfessor for the college. Explain why inference about the satisfaction levels of a given college are suspect with this approach.
Beware of searching for significance
Statistical significance is an outcome much desired by researchers and data analysts. It means (or ought to mean) that you have found an effect that you were looking for. The reasoning behind statistical significance works well if you decide what effect you are seeking, design an experiment or sample to search for it, and use a test of significance to weigh the evidence you get. In other settings, significance may have little meaning.
But because a successful search for a new scientifc phenomenon often ends with statistical significance, it is all too tempting to make significance itself the object of the search. There are several ways to do this, none of them acceptable in polite scientifc society.
EXAMPLE 6.25 Cell Phones and Brain Cancer
Might the radiation from cell phones be harmful to users? Many studies have found little or no connection between using cell phones and various illnesses. Here is part of a news account of one study:
A hospital study that compared brain cancer patients and a similar group without brain cancer found no statistically signifcant association between cell phone use and a group of brain cancers known as gliomas. But when 20 types of glioma were considered separately, an association was found between phone use and one rare form. Puzzlingly, however, this risk appeared to decrease rather than increase with greater mobile phone use.21
Think for a moment: Suppose that the 20 null hypotheses for these 20 sig-nifcance tests are all true. Then each test has a 5% chance of being signifcant at the 5% level. That’s what α=0.05 means—results this extreme occur only 5% of the time just by chance when the null hypothesis is true. Because 5% is 1/20, we expect about one of 20 tests to give a signifcant result just by chance. Running one test and reaching the α=0.05 level is reasonably good evidence that you have found something; running 20 tests and reaching that level only once is not.
The peril of multiple testing is increased now that a few simple commands will set software to work performing a slew of complicated tests and operations on your data. We state as a law that any large set of data—even several pages of a table of random digits—contains some unusual pattern. Sufficient computer time will discover that pattern, and, when you test specifically for the pattern that turned up, the result will be signifcant.
The dangers of unbridled multiple testing are never more evident than with the “big data” movement sweeping through the corporate world. With “big data,” data analysts at companies are combing through massive data sets across multiple variables on consumer behavior with the hope to find signifcant relationships that can be leveraged for competitive advantage. By searching through mega data sets and thousands of variables, it is not hard to imagine that signifcant relationships are bound to be identified. However, these signifcant relationships are often caused entirely by chance and have no real predictive power. Such relationships, in the end, are commonly referred to as false-positives.
false-positives
These warnings are not to suggest that searching data for patterns is not legitimate. It certainly is. Many important discoveries, scientifc and business related, have been made by accident rather than by design. Exploratory analysis of data is an essential part of statistics. We do mean that the usual reasoning of statistical inference does not apply when the search for a pattern is successful. You cannot legitimately test a hypothesis on the same data that first suggested that hypothesis. The remedy is clear. Once you have a hypothesis, design a study to search specif-cally for the effect you now think is there. If the result of this study is statistically signifcant, you have real evidence.