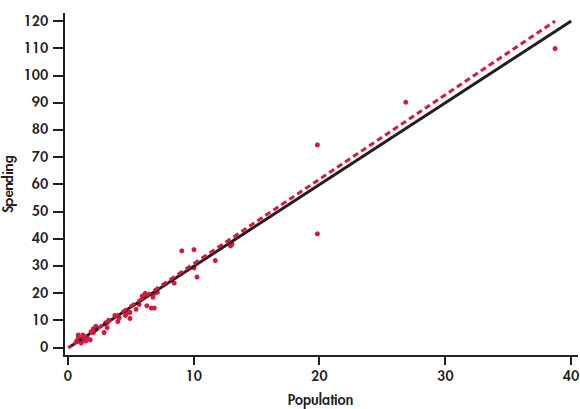
FIGURE 2.12 Scatterplot of spending on education versus the population. The two lines are the least-squares regression lines: using population to predict spending on education (solid) and using spending on education to predict population (dashed), Example 2.14.