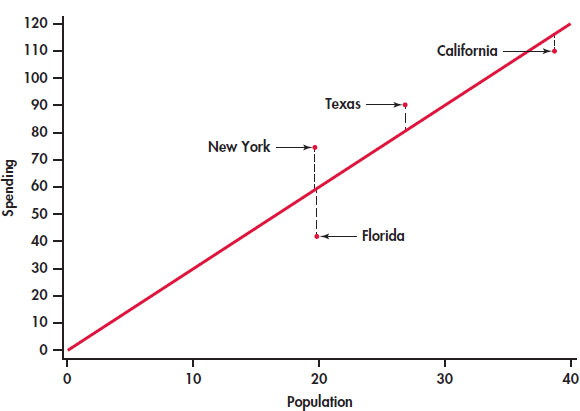
FIGURE 2.13
Scatterplot of spending on education versus the population for 50 states, with the least-squares line and selected points labeled,
Example 2.16
.