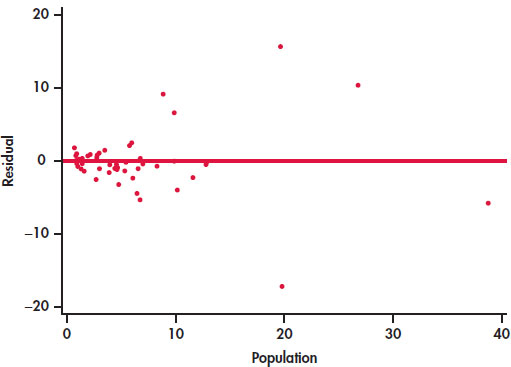
FIGURE 2.14
Residual plot for the education spending data,
Example 2.17
.