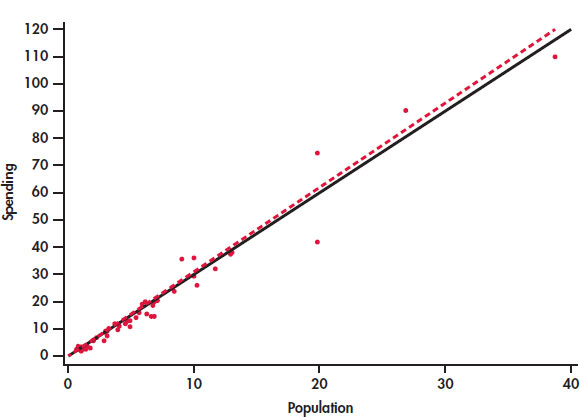
FIGURE 2.17 Two least-squares lines for the education spending data, Example 2.19. The solid line is calculated using all of the data. The dashed line leaves out the data for California. The two lines are very similar, so we conclude that California is not influential.