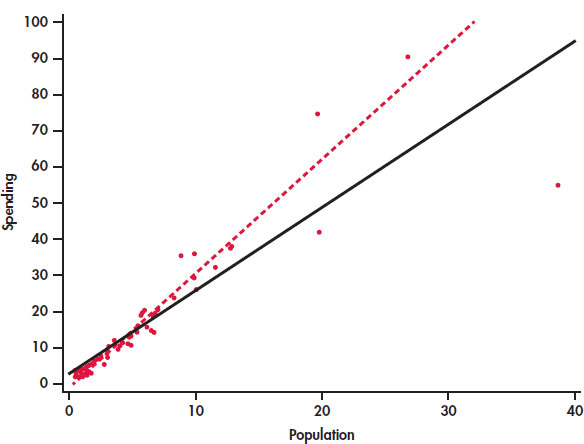
FIGURE 2.18 Two least-squares lines for the education spending data with the California education spending changed to $55 million, Example 2.20. The solid line is calculated using all of the data. The dashed line leaves out the data for California, which is influential here. California pulls the least-squares regression line toward it.