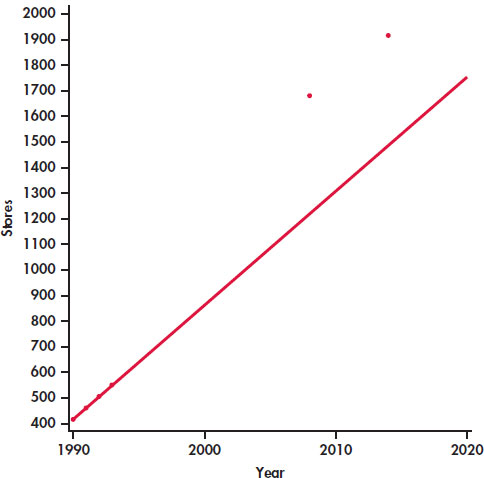
FIGURE 2.19 Plot of the number of Target stores versus year with the least-squares regression line calculated using data from 1990, 1991, 1992, and 1993, Example 2.22. The poor fits to the numbers of stores in 2008 and 2014 illustrate the dangers of extrapolation.