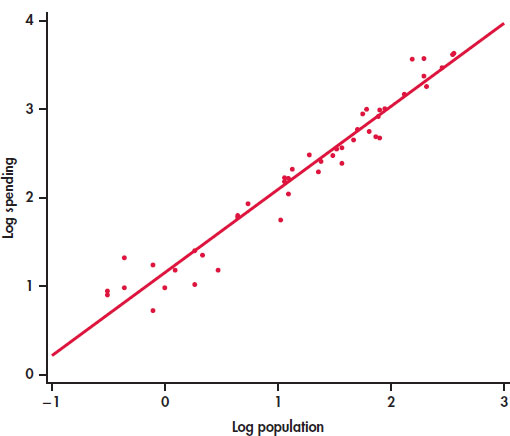
FIGURE 2.5
Scatterplot of log spending on education versus log population with a fitted straight line,
Example 2.6
.