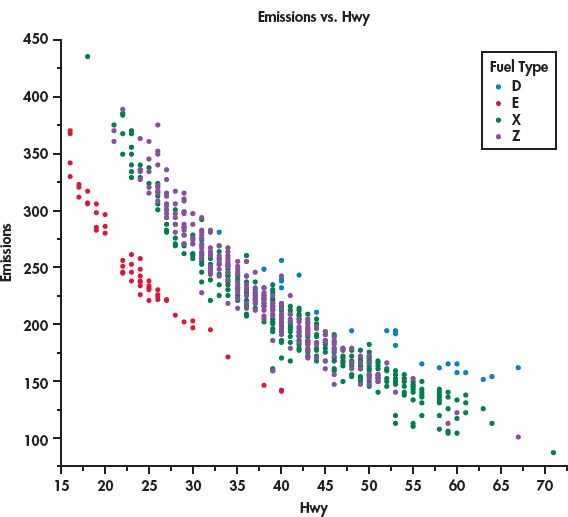
FIGURE 2.6 Scatterplot of CO2 emissions versus highway MPG for 1067 vehicles for the model year 2014 using JMP software. Colors correspond to the type of fuel used: blue for diesel, red for ethanol, green for regular gasoline, and purple for premium gasoline, Example 2.7.