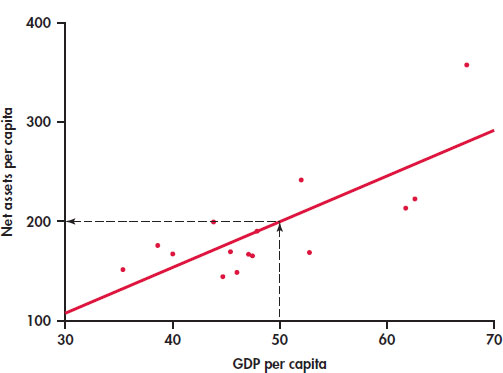
FIGURE 2.9 Scatterplot of GDP per capita and net assets per capita for 15 countries that rank high on financial development, Example 2.9. The dashed line indicates how to use the regression line to predict net assets per capita for a country with a GDP per capita of 50.