EXAMPLE 2.13 GDP and Assets Results Using Software

Figure 2.11 displays the selected regression output for the world financial markets data from JMP, Minitab, and Excel. The complete outputs contain many other items that we will study in Chapter 10.
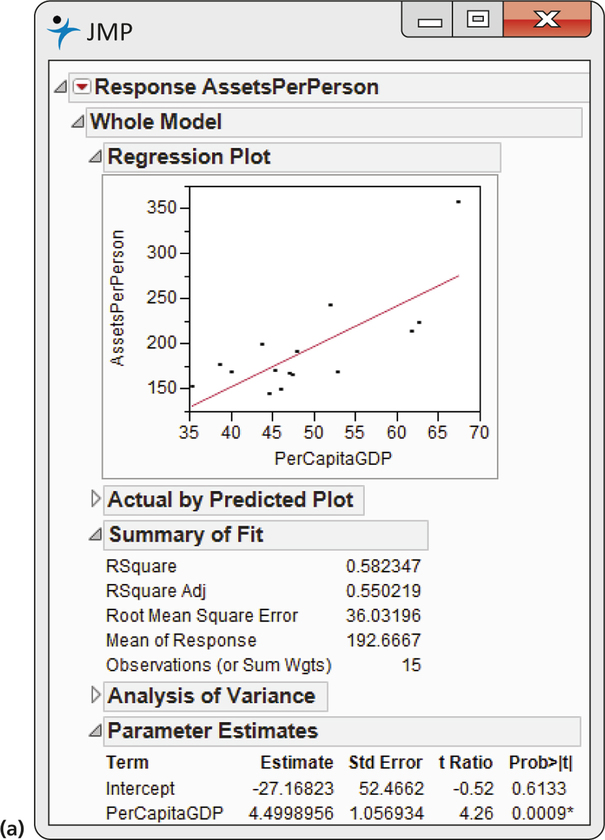

Let’s look at the Minitab output first. A table gives the regression intercept and slope under the heading “Coefficients.” Coefficient is a generic term that refers to the quantities that define a regression equation. Note that the intercept is labeled “Constant,” and the slope is labeled with the name of the explanatory variable. In the table, Minitab reports the intercept as −27.2 and the slope as 4.50 followed by the regression equation.
Coefficient
85
86
Excel provides the same information in a slightly different format. Here the intercept is reported as −27.16823305, and the slope is reported as 4.4998956. Check the JMP output to see how the regression coefficients are reported there.