EXAMPLE 2.14 Education Spending and Population

CASE 2.1 Figure 2.12 is a scatterplot of the education spending data described in Case 2.1 (page 65). There is a positive linear relationship.
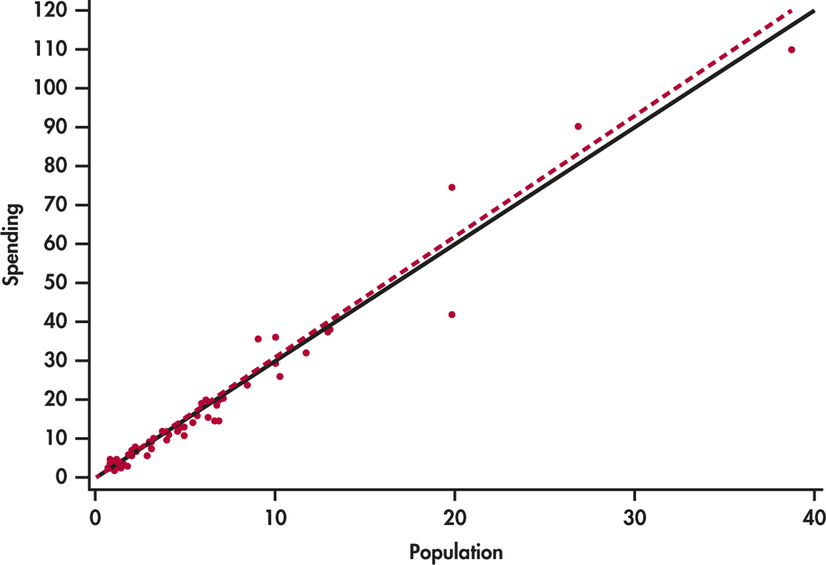
Figure 2.12: FIGURE 2.12 Scatterplot of spending on education versus the population. The two lines are the least-squares regression lines: using population to predict spending on education (solid) and using spending on education to predict population (dashed), Example 2.14.
The two lines on the plot are the two least-squares regression lines. The regression line for using population to predict education spending is solid. The regression line for using education spending to predict population is dashed. The two regressions give different lines. In the regression setting, you must choose one variable to be explanatory.