EXAMPLE 2.17 Residual Plot for Education Spending

CASE 2.1 Figure 2.14 gives the residual plot for the education spending data. The horizontal line at zero in the plot helps orient us.
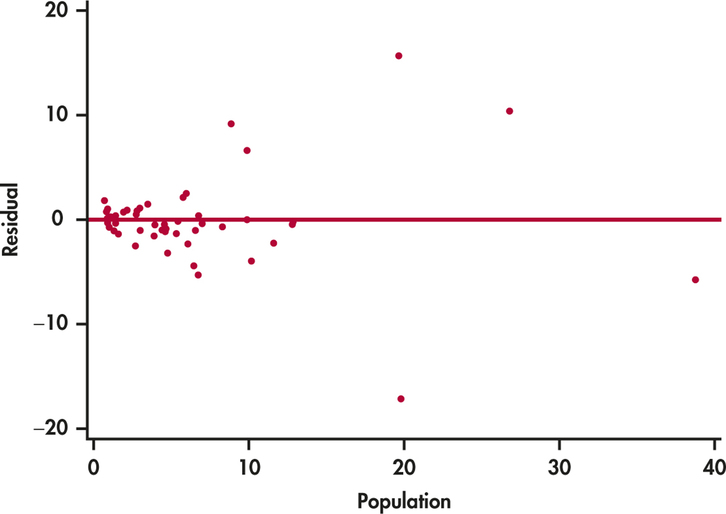
Figure 2.14: FIGURE 2.14 Residual plot for the education spending data, Example 2.17.