EXAMPLE 2.18 Are the Residuals Approximately Normal?

CASE 2.1 Figure 2.16 gives the Normal quantile plot for the residuals in our education spending example. The distribution of the residuals is not Normal. Most of the points are close to a line in the center of the plot, but there appear to be five outliers—one with a negative residual and four with positive residuals.
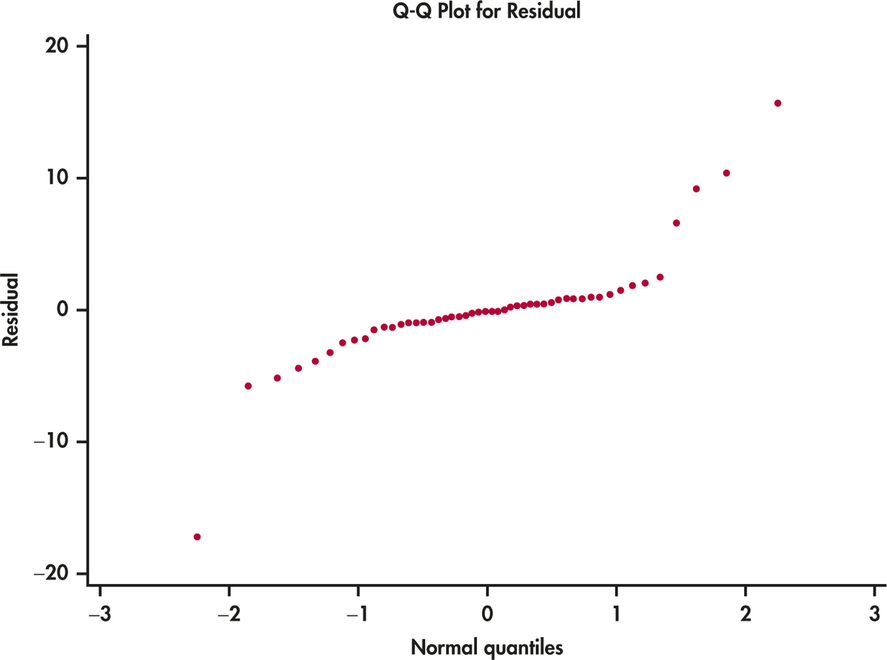
Figure 2.16: FIGURE 2.16 Normal quantile plot of the residuals for the education spending regression, Example 2.18.