EXAMPLE 2.22 Predicting the Number of Target Stores in 2008 and 2014

Here are data on the number of Target stores in operation at the end of each year in the early 1990s in 2008 and in 2014:12
| Year (x) | 1990 | 1991 | 1992 | 1993 | 2008 | 2014 |
| Stores (y) | 420 | 463 | 506 | 554 | 1682 | 1916 |

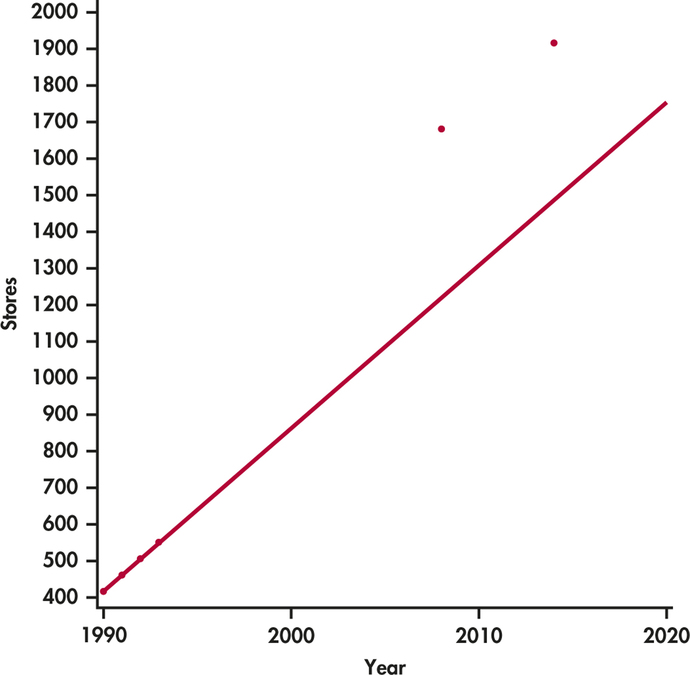
A plot of these data is given in Figure 2.19. The data for 1990 through 1993 lie almost exactly on a straight line, which we calculated using only the data from 1990 to 1993. The equation of this line is y = −88,136 1 44.5x and r2 = 0.9992. We know that 99.92% of the variation in stores is explained by year for these years. The equation predicts 1220 stores for 2008, but the actual number of stores is much higher, 1682. It predicts 1487 for 2014, also an underestimate by a large amount. The predictions are very poor because the very strong linear trend evident in the 1990 to 1993 data did not continue to the years 2008 and 2014.