EXAMPLE 2.23 Gas and Electricity Bills
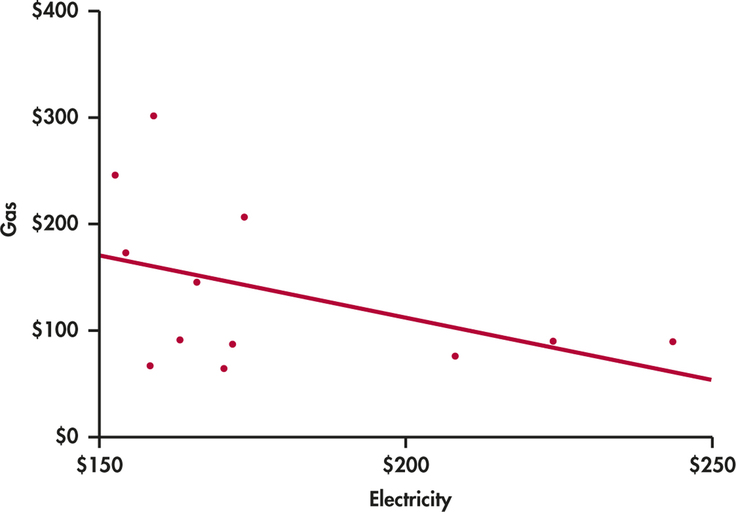
A single-family household receives bills for gas and electricity each month. The 12 observations for a recent year are plotted with the least-squares regression line in Figure 2.20. We have arbitrarily chosen to put the electricity bill on the x axis and the gas bill on the y axis. There is a clear negative association. Does this mean that a high electricity bill causes the gas bill to be low, and vice versa?
To understand the association in this example, we need to know a little more about the two variables. In this household, heating is done by gas and cooling by electricity. Therefore, in the winter months, the gas bill will be relatively high and the electricity bill will be relatively low. The pattern is reversed in the summer months. The association that we see in this example is due to a lurking variable: time of year.