EXAMPLE 2.27 Software Output for Wine and Music

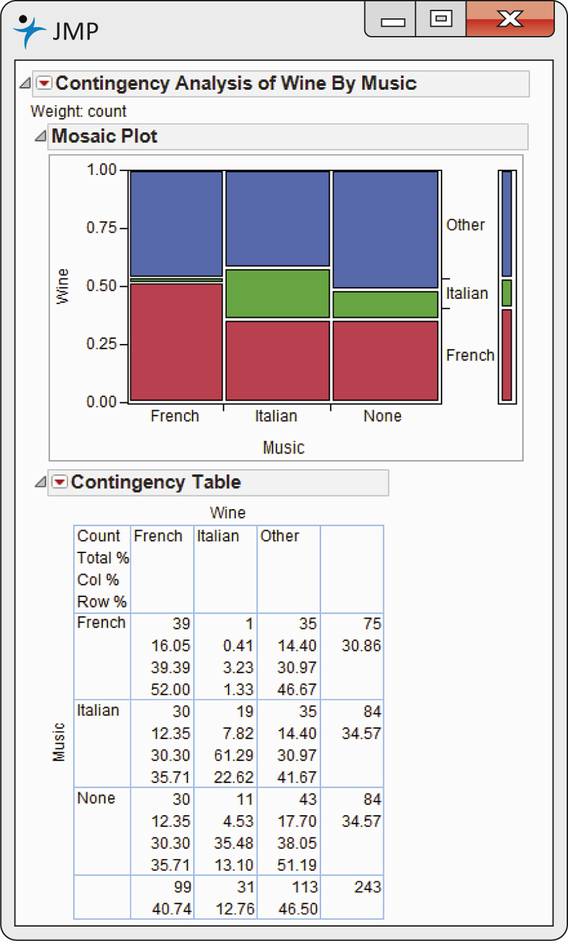
CASE 2.2 Output from JMP statistical software for the wine and music data is given in Figure 2.23. The mosaic plot is given in the top part of the display. Here, we think of music as the explanatory variable and wine as the response variable, so music is displayed across the x axis in the plot. The conditional distributions of wine for each type of music are displayed in the three columns. Note that when French is playing, 52% of the wine sold is French wine. The red bars display the percents of French wine sold for each type of music. Similarly, the green and blue bars display the correspondence to Italian wine and other wine, respectively. The widths of the three sets of bars display the marginal distribution of music. We can see that the proportions are approximately equal, but the French wine sold a little less than the other two categories of wine.
110