EXAMPLE 2.4 Scatterplot with a Straight Line

CASE 2.1 Figure 2.2 plots the education spending data along with a fitted straight line. This plot confirms our initial impression about these data. The overall pattern is approximately linear and there are a few states with relatively high values for both variables.
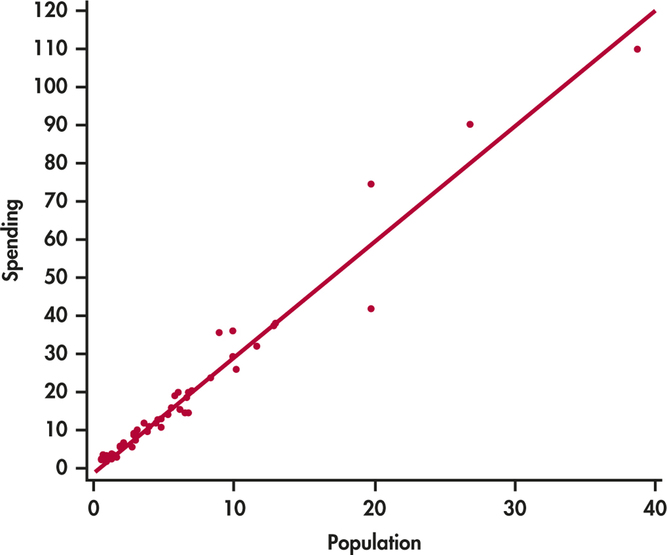
Figure 2.2: FIGURE 2.2 Scatterplot of spending on education (in billions of dollars) versus population (in millions) with a fitted straight line, Example 2.4.