EXAMPLE 2.7 Fuel Efficiency and CO_2 Emissions

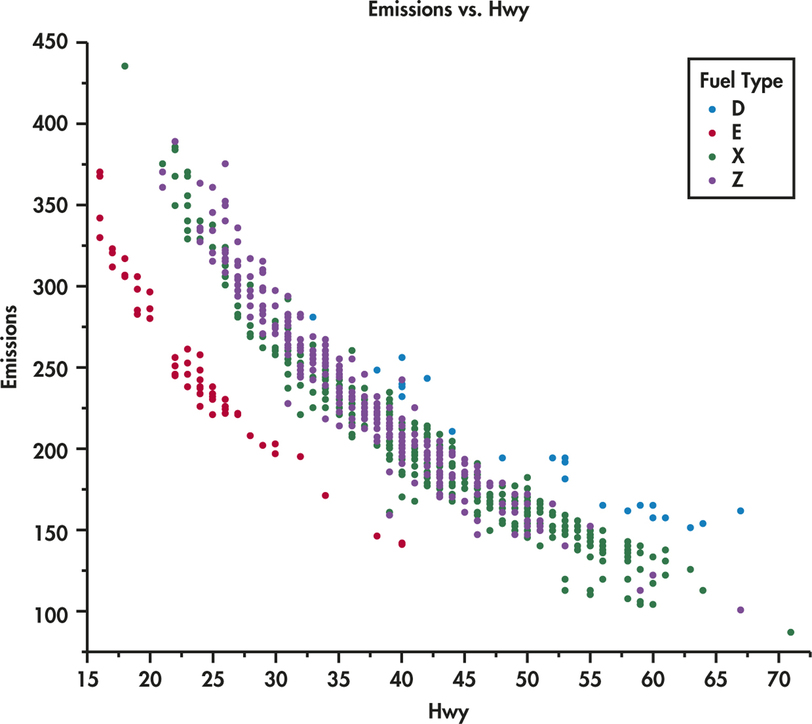
Let’s look at the relationship between highway MPG and CO2 emissions, two quantitative variables, while also taking into account the type of fuel, a categorical variable. The JMP statistical software was used to produce the plot in Figure 2.6. We see that there is a negative relationship between the two quantitative variables. Better (higher) MPG is associated with lower CO2 emissions. The relationship is curved, however, not linear.
71
The legend on the right side of the figure identifies the colors used to plot the four types of fuel, our categorical variable. The vehicles that use regular gasoline (green) and premium gasoline (purple) appear to be mixed together. The diesel-burning vehicles (blue) are close to the the gasoline-burning vehicles, but they tend to have higher values for both MPG and emissions. On the other hand, the vehicles that burn ethanol (red) are clearly separated from the other vehicles.