Figure 2.2:
FIGURE 2.2
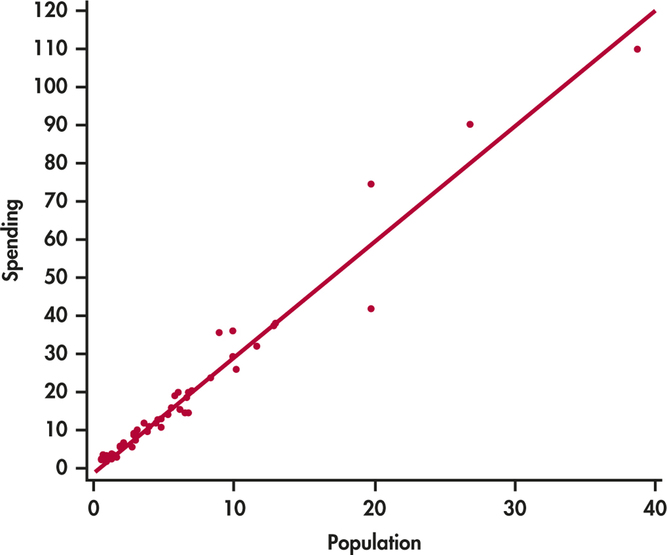
Scatterplot of spending on education (in billions of dollars) versus population (in millions) with a fitted straight line,
Example 2.4
.