Figure 2.20:
FIGURE 2.20
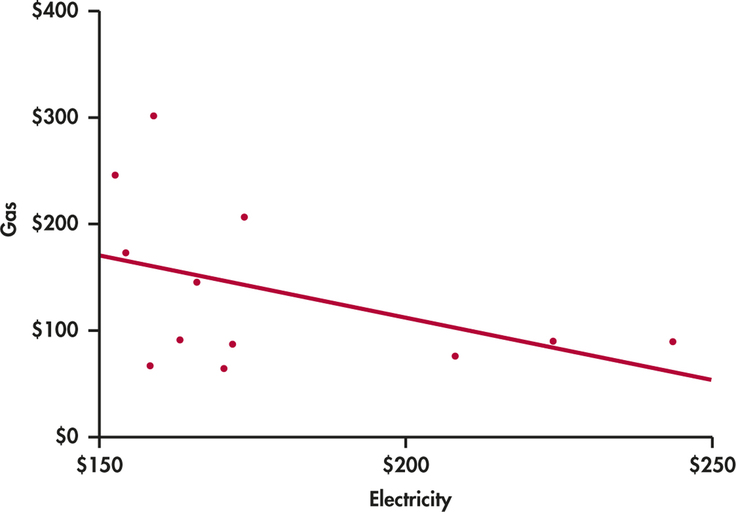
Scatterplot with the least-squares regression line for predicting monthly charges for gas using monthly charges for electricity for a household,
Example 2.23
.