Figure 2.24:
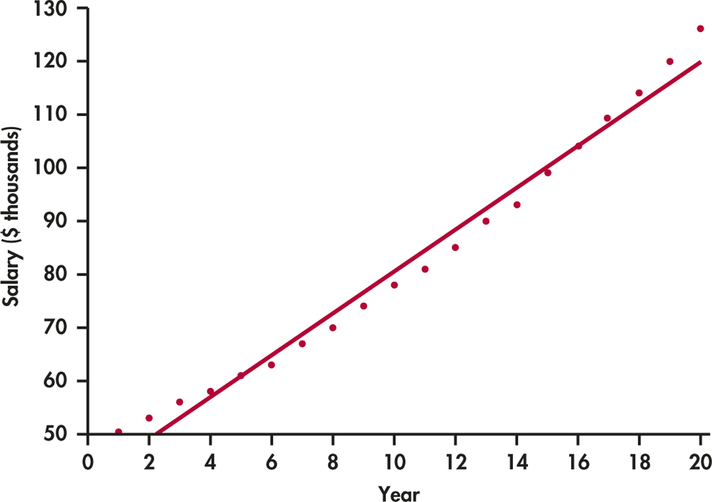
FIGURE 2.24
Plot of salary versus year, with the least-squares regression line, for an individual who receives approximately a 5% raise each year for 20 years,
Exercise 2.124
.