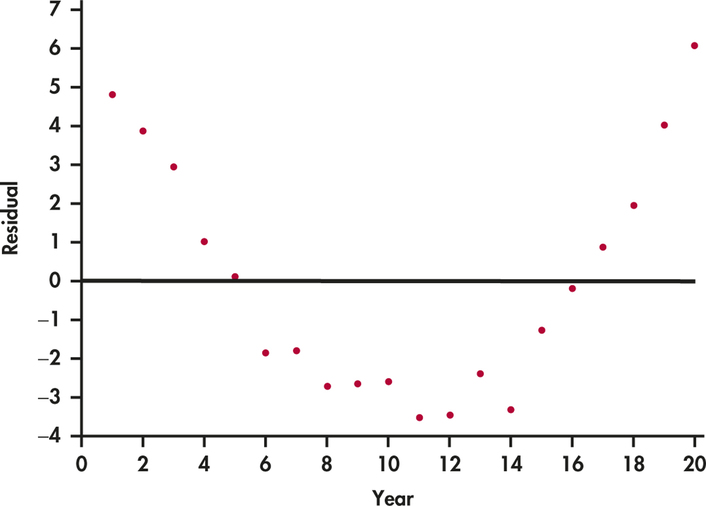
FIGURE 2.25
Plot of residuals versus year for an individual who receives approximately a 5% raise each year for 20 years,
Exercise 2.125
.