Question 2.126
2.126 Try logs
Refer to the previous two exercises. Figure 2.26 is a scatterplot with the least-squares regression line for log salary versus year. For this model, r2 = 0.9995. 
- Compare this plot with Figure 2.24. Write a short summary of the similarities and the differences.
- Figure 2.27 is a plot of the residuals for the model using year to predict log salary. Compare this plot with Figure 2.25 and summarize your findings.
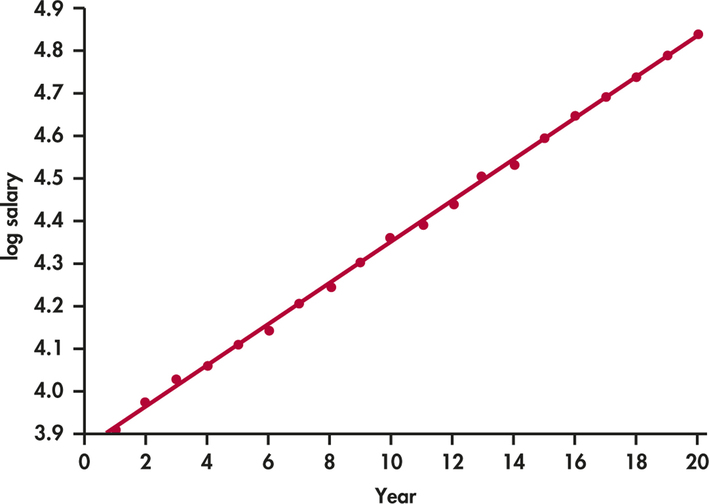
Figure 2.26: FIGURE 2.26 Plot of log salary versus year, with the least-squares regression line, for an individual who receives approximately a 5% raise each year for 20 years, Exercise 2.126.
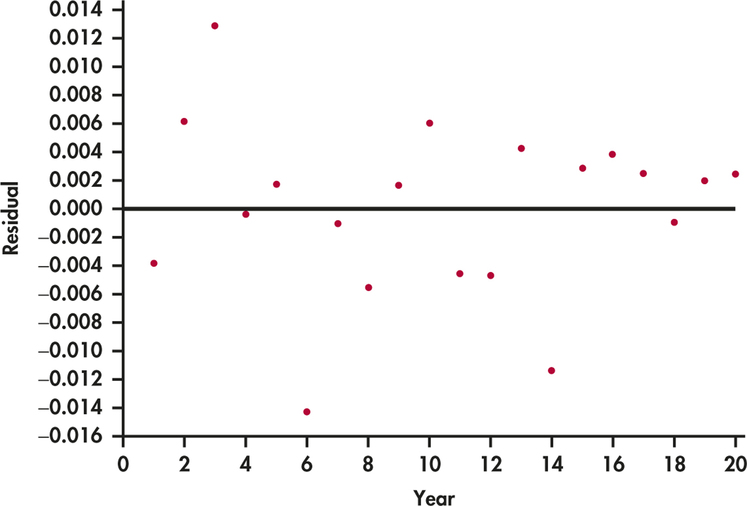
Figure 2.27: FIGURE 2.27 Plot of residuals, based on log salary, versus year for an individual who receives approximately a 5% raise each year for 20 years, Exercise 2.126.