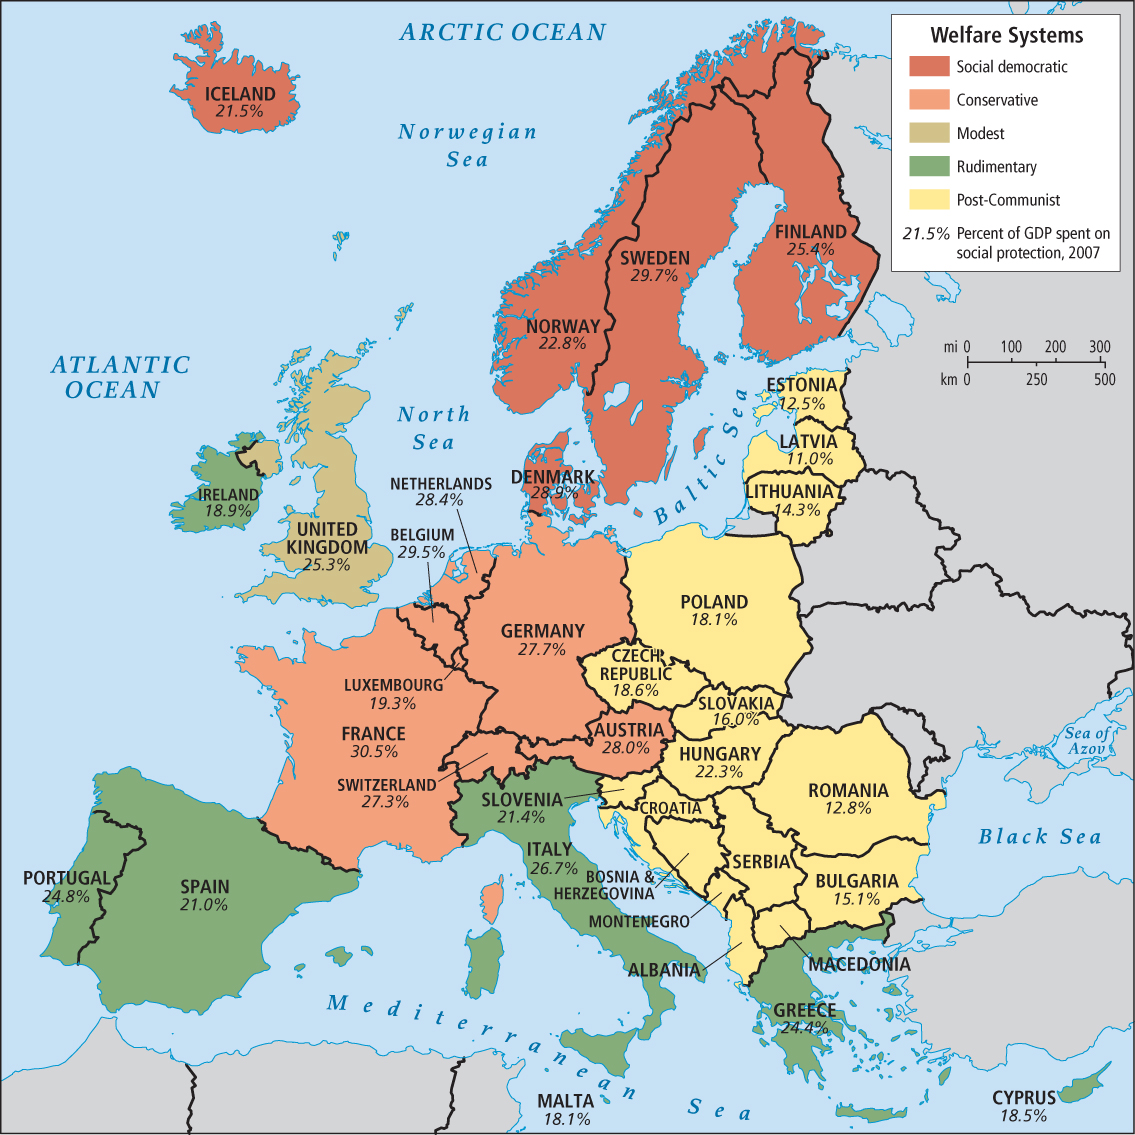
FIGURE 4.26 European social welfare/protection systems. The basic categories of social welfare systems shown here and described in the text should be taken as only an informed approximation of the existing patterns. In 2007 (the latest data available from the EU), the average expenditures for social protection in the EU-28 were about 26.7% of GDP. The map shows the percent of GDP spent on social protection by the EU-28 countries in 2007. The 2007 data do not include Croatia.