1.6 Water and Global Climate Change
Water is emerging as the major resource issue of the twenty-first century. Demand for clean water skyrockets as people move out of poverty. A huge increase in water consumption occurs with the modernization of the production of foods, the manufacture of goods, the creation of energy, and the development of services (like cleaning or even entertainment). Modernization also inevitably creates water pollution. With clean, fresh water becoming scarce in so many parts of the world, water disputes are proliferating. This is especially true where rivers cross international borders and upstream users use more than their perceived fair share or pollute water for downstream users. Controversy also surrounds the sale of clean water. When water becomes a commodity rather than a free good, as it was before modern times, water prices can increase so much that the poor lose access, which then affects health and sanitation.
Calculating Water Use per Capita
virtual water the volume of water used to produce all that a person consumes in a year
water footprint the water used to meet a person’s basic needs for a year, added to the person’s annual virtual water consumption
| Product† | Virtual water content (in liters) |
|---|---|
| 1 potato | 25 |
| 1 cup tea | 35 |
| 1 slice of bread | 40 |
| 1 apple | 70 |
| 1 glass of beer | 75 |
| 1 glass of wine | 120 |
| 1 egg | 135 |
| 1 cup of coffee | 140 |
| 1 glass of orange juice | 170 |
| 1 pound of chicken meat | 2000 |
| 1 hamburger | 2400 |
| 1 pound of cheese | 2500 |
| 1 pair of bovine leather shoes | 8000 |
| *Virtual water is the volume of water used to produce a product. | |
| †To see the virtual water content of additional products, go to www.waterfootprint.org/?page=files/productgallery. | |
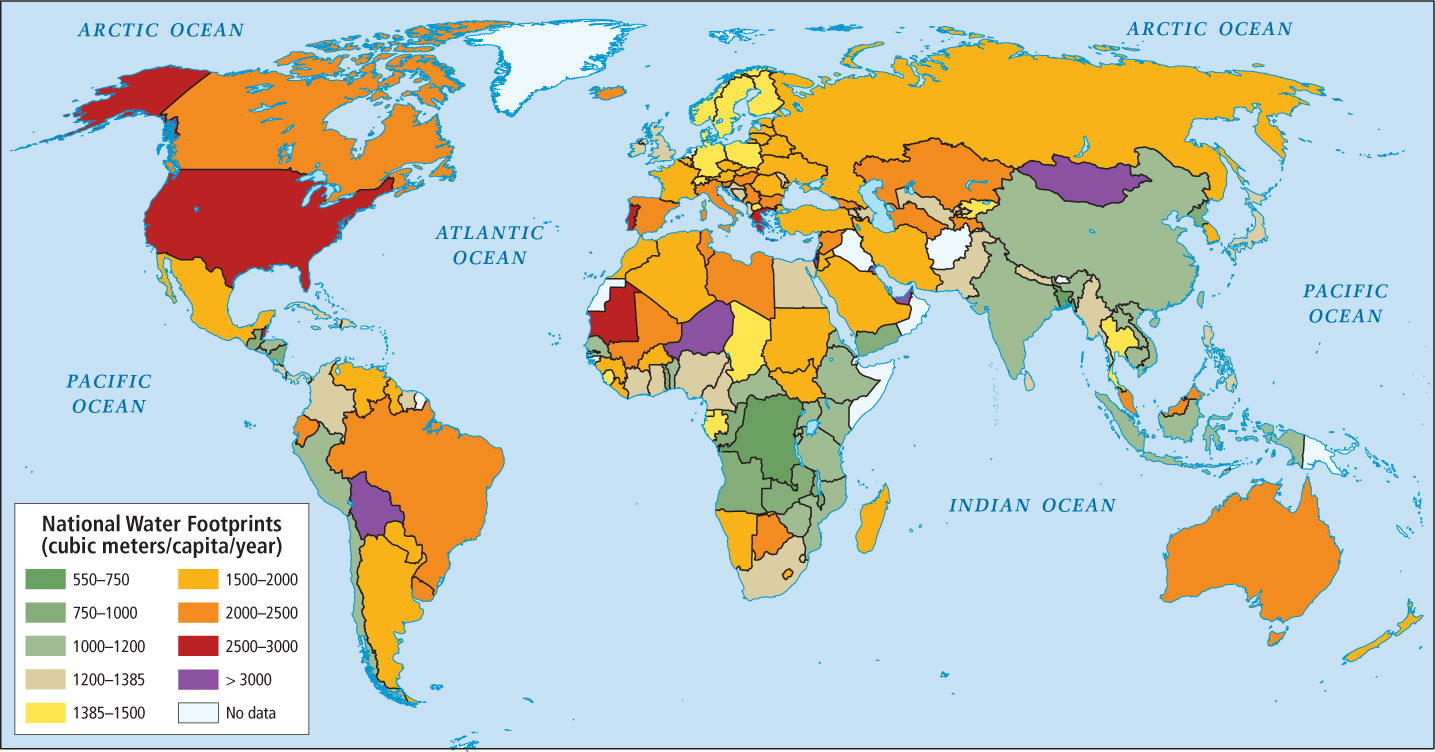
Like domestic consumption, personal water footprints vary widely according to physical geography, standards of living, and rates of consumption (Figure 1.20). Moreover, the amount of virtual water used to produce 1 ton of a specific product varies widely from country to country due to climate conditions, along with agricultural and industrial technology and efficiency. For example, on average, to produce 1 ton of corn in the United States requires 489 m3 of virtual water, whereas in India the same amount of corn requires 1935 m3 of virtual water; in Mexico, 1744 m3; and in the Netherlands, just 408 m3. In the case of corn, water can be lost to evapotranspiration in the field, to the evaporation of standing irrigation water, and to evaporation as water flows to and from the field. A further component of virtual water is that the water that becomes polluted in the production process is also lost to further use.
For help calculating your individual water footprint, go to the Water Footprint Web site, at http://www.waterfootprint.org/?page=cal/waterfootprintcalculator_indv.
Who Owns Water? Who Gets Access to It?
Though many people consider water a human right that should not cost anything to access, water has become the third most valuable commodity, after oil and electricity. Water in wells and running in streams and rivers is increasingly being privatized. This means that its ownership is being transferred from governments—which can be held accountable for protecting the rights of all citizens to water access—to individuals, multinational corporations, and other private entities that manage the water primarily for profit. Governments often privatize water under the rationale that private enterprise will make needed investments that will boost the efficiency of water distribution systems and the overall quality of the water supply. Regardless of whether or not these potential gains are actually realized, privatization usually brings higher water costs to consumers. This can become quite controversial. For example, in 1999 in the city of Cochabamba, Bolivia, water costs rose beyond what the urban poor could afford, following the sale of the city public water agency to a group of multinational corporations led by Bechtel of San Francisco, California. The result was a nationwide series of riots that led finally to the abandonment of privatization.
Water Quality
About one-sixth of the world’s population does not have access to clean drinking water, and dirty water kills over 6 million people each year. More people die this way than in all of the world’s armed conflicts for an average year. In the poorer parts of cities in the developing world, many people draw water with a pail from a communal spigot, sometimes from shallow wells, or simply from holes dug in the ground (Figure 1.21). Usually this water should be boiled before use, even for bathing. These water quality and access problems help explain why so many people are chronically ill and why 24,000 children under the age of 5 die every day from waterborne diseases.
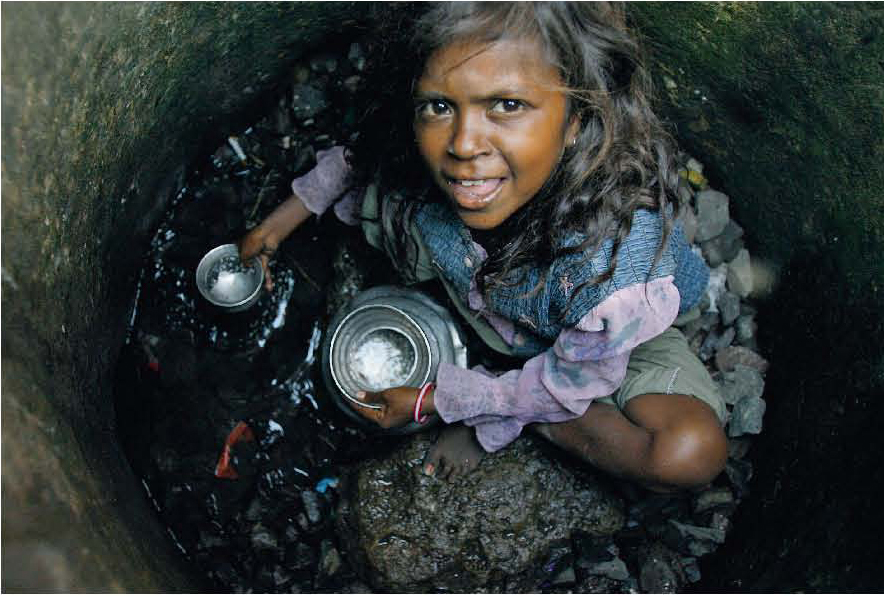
Courtesy Sajjad Hussain/AFP/Getty Images
Thinking Geographically
Question
Why might this child be endangering his health by drinking this water?
| A. |
| B. |
| C. |
| D. |
In Europe and the United States, demand for higher water quality has resulted in a $100 billion bottled water industry. However, there are few standards of quality for bottled water; and in addition to generating mountains of plastic bottle waste, the bottled water industry often acquires its water from sources (springs, ponds, deep wells) that are publicly owned. Hence, consumers are unwittingly paying for the same high-quality water they could consume free as a public commodity. 245. CLEAN WATER PROJECT IMPROVES LIVES IN SENEGAL
Water and Urbanization
Urban development patterns dramatically affect the management of water. In most urban slum areas in poor countries, and even in places like the United States and Canada, crucial water management technologies such as sewage treatment systems can be entirely absent. Germ-laden human waste from toilets and kitchens may be deposited in urban gutters that drain into creeks, rivers, and bays. And yet, retrofitting adequate wastewater collection and treatment systems, in cities already housing several million inhabitants, is often deemed prohibitively costly, especially in poor countries.
Independent of sewage, water inevitably becomes polluted in cities as parking lots and rooftops replace areas that were once covered with natural vegetation. Rainwater quickly runs off these hard surfaces, collects in low places, and becomes stagnant instead of being absorbed into the ground. In urban slums, flooding can spread polluted water over wide areas, carrying it into homes and local fresh water sources, as well as places where children play (see Figure 1.21). Diseases such as malaria and cholera, carried in this water, can spread rapidly as a result. Fortunately, new technologies and urban planning methods are being developed that can help cities avoid these problems, but they are not yet in widespread use.
THINGS TO REMEMBER
 Water scarcity is emerging as the major resource issue of the twenty first century, with water supplies strained by population growth, skyrocketing per capita demand for clean water, and water pollution.
- Much of the water that humans use they never see because it is virtual water: that which is used to produce what they consume.
- Urbanization often leads to water pollution through untreated sewage, industrial production, and mismanaged storm water.
1.6.1 Global Climate Change
climate change a slow shifting of climate patterns due to the general cooling or warming of the atmosphere
global warming the warming of the Earth’s climate as atmospheric levels of greenhouse gases increase
greenhouse gases gases, such as carbon dioxide and methane, released into the atmosphere by human activities, which become harmful when released in excessive amounts
Most scientists now agree that there is an urgent need to reduce greenhouse gas emissions to avoid catastrophic climate change incoming years. Climatologists, biogeographers, and other scientists are documenting long-term global warming and cooling trends by examining evidence in tree rings, fossilized pollen and marine creatures, and glacial ice. These data indicate that the twentieth century was the warmest century in 600 years, with the decade of the 1990s as the hottest since the late nineteenth century. Evidence is mounting that these are not normal fluctuations. Very long-term climate-change patterns indicate that we should be heading into a cooling pattern, but instead it is estimated that, at present rates of warming, by 2100 average global temperatures could rise between 2.5°F and 10°F (about 2°C to 5°C).
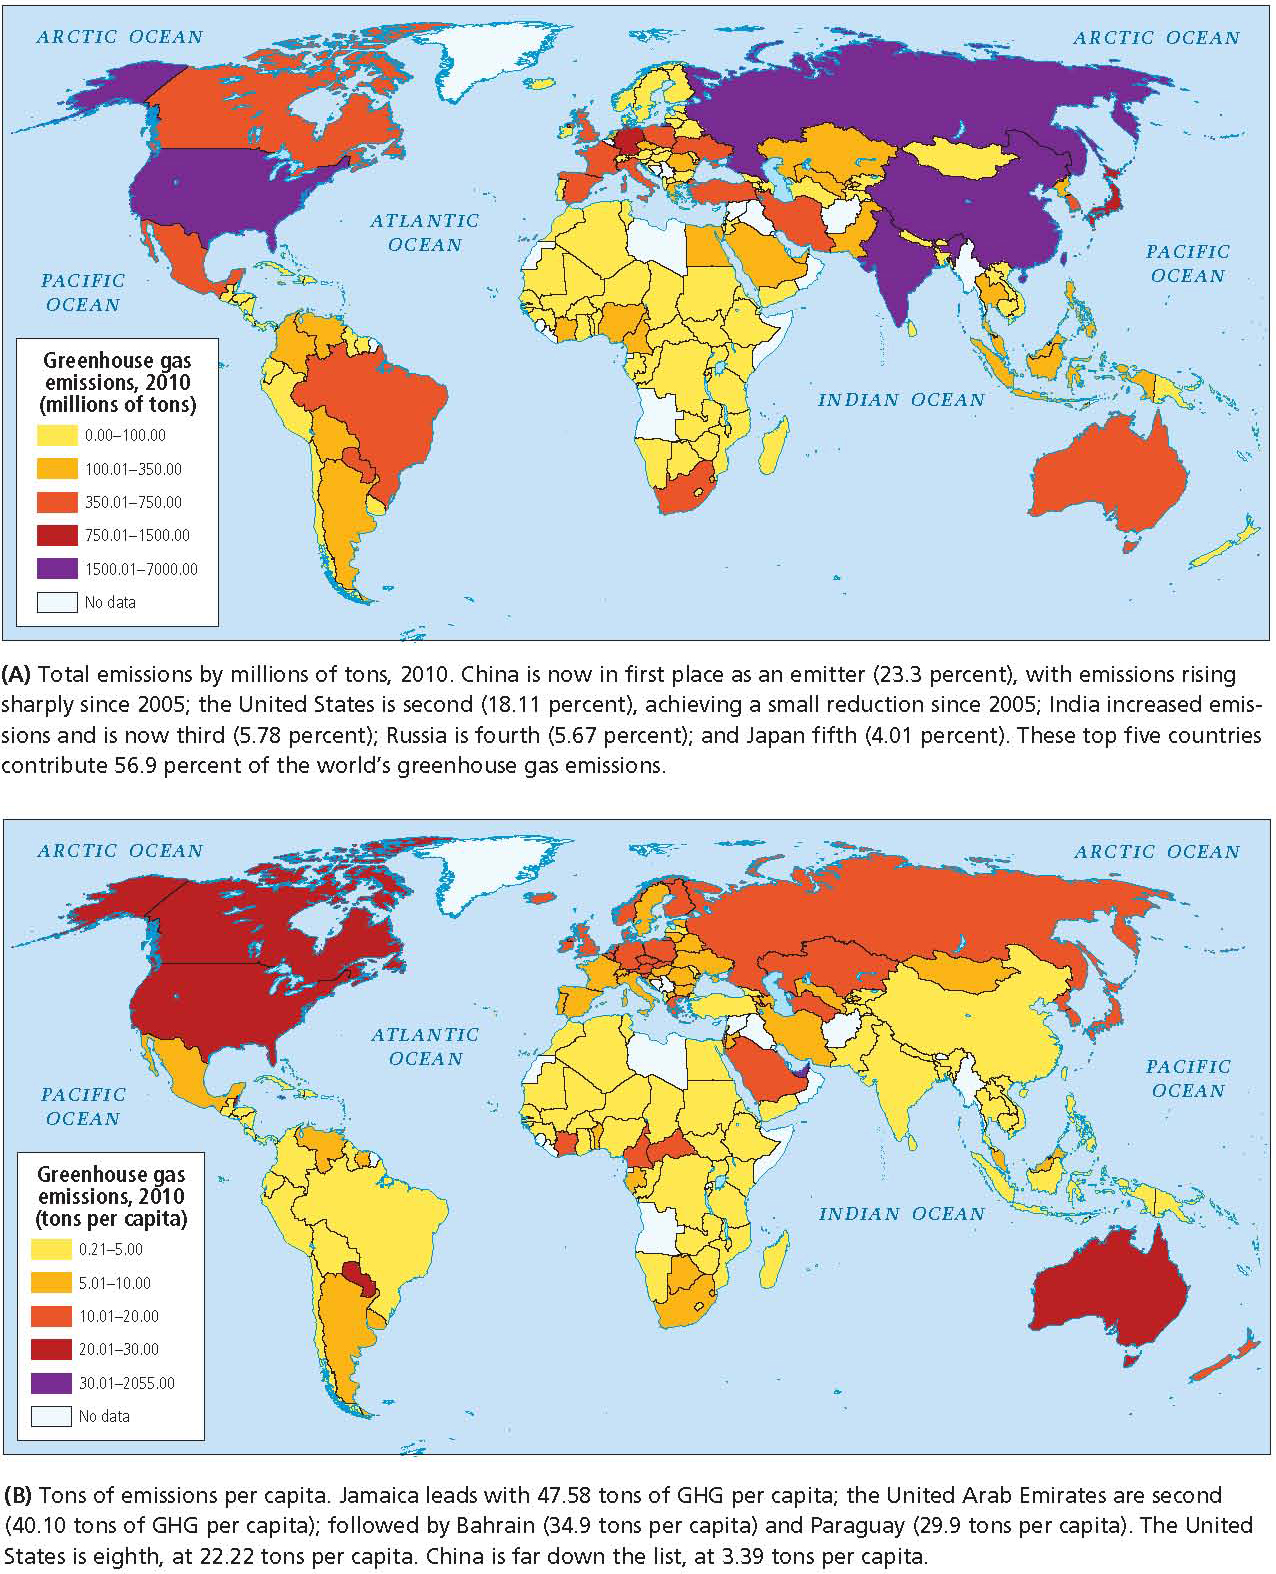
However, a key problem is that those most responsible for global warming (the world’s wealthiest and most industrialized countries) have the least incentive to reduce emissions because they are the least vulnerable to the changes global warming causes in the physical environment. Meanwhile, those most vulnerable to these changes (poor countries with low human development and with large slums in low-lying coastal wetlands) are the least responsible for the growth in greenhouse gases and have the least power in the global geopolitical sphere; hence they have the least ability to affect the level of emissions (Figure 1.23).
Drivers of Global Climate Change
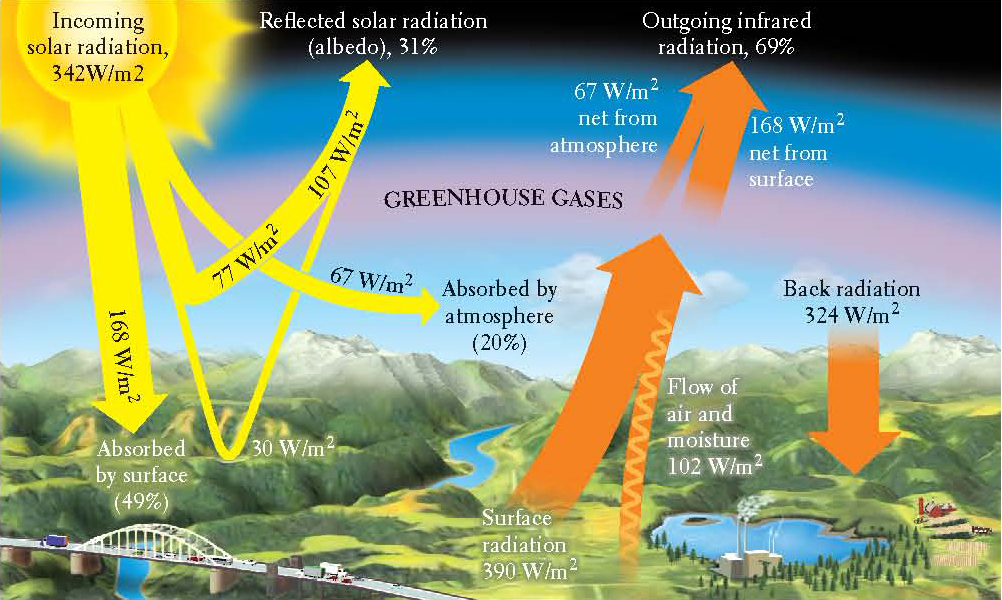
Greenhouse gases exist naturally in the atmosphere. It is their heat-trapping ability that makes the Earth warm enough for life to exist. Increase their levels, as humans are doing now, and the Earth becomes warmer still.
Electricity generation, vehicles, industrial processes, and the heating of homes and businesses all burn large amounts of CO2-producing fossil fuels such as coal, natural gas, and oil. Even the large-scale raising of grazing animals contributes methane through the animals’ flatulence. Unusually large quantities of greenhouse gases from these sources are accumulating in the Earth’s atmosphere, and their presence has already led to significant warming of the planet’s climate.
Widespread deforestation worsens the situation. Living forests take in CO2 from the atmosphere, release the oxygen, and store the carbon in their biomass. As more trees are cut down and their wood is used for fuel, more carbon enters the atmosphere, less is taken out, and less is stored. The loss of trees and other forest organisms produces as much as 30 percent of the buildup of CO2 in the atmosphere. The use of fossil fuels accounts for the remaining 70 percent.
In percentages, the largest producers of total greenhouse gas emissions (GHG) in 2010 were the industrialized countries and large, rapidly developing countries. The caption of Figure 1.23 lists the countries that are the most responsible for GHG emissions, total (A) and per capita (B). Note that the United States is among the leaders in both categories. For the period of 1859 to 1995, developed countries produced roughly 80 percent of the greenhouse gases from all types of industrial, home, and transport sources, and developing countries produced 20 percent. But by 2007, the developing countries were catching up, accounting for nearly 30 percent of total emissions. As developing countries industrialize over the next century and continue to cut down their forests, they will release more and more greenhouse gases every year. If present patterns hold, greenhouse gas contributions by the developing countries will exceed those of the developed world by 2040.
Climate-Change Impacts
While it is not clear just what the impacts of rising global temperatures will be, it is clear that they will not be uniform across the globe. One prediction is that the glaciers and polar ice caps will melt, causing a corresponding rise in sea level. In fact, this phenomenon has been observable for several years. Satellite imagery analyzed by scientists at the National Aeronautics and Space Administration (NASA) shows that between 1979 and 2005—just 26 years—the polar ice caps shrank by about 23 percent. The amount of polar ice cap shrinkage wavers from year to year, with the ice caps regaining ice to some extent during winter months, but the overall trend in recent years is 12 percent shrinkage per decade. The polar ice caps normally reflect solar heat back into the atmosphere, but as the ice melts, the dark, open ocean absorbs solar heat. This warming of the oceans not only hastens ice cap melting, it is changing ocean circulation, which is the engine of weather and climate globally.
The melting of the ice caps has several other effects. Already, trillions of gallons of meltwater have been released into the oceans. If this trend continues, at least 60 million people in coastal areas and on low-lying islands could be displaced by rising sea levels. Another issue is the melting of high mountain glaciers, which are a major source of water for many of the world’s large rivers, such as the Ganga, the Indus, the Brahmaputra, the Huang He (Yellow), and the Chang Jiang (Yangtze). Similar melting effects on crucial rivers are expected in South America. Scientists have monitored mountain glaciers across the globe for more than 30 years; while some are growing, the majority are melting rapidly. Over the short term, melting mountain glaciers could result in flooding in many rivers, but eventually river flows will decrease as mountain glaciers shrink or disappear entirely.
Over time, higher temperatures will shift northward in the Northern Hemisphere and southward in the Southern Hemisphere, bringing warmer climate zones to these regions. Such climate shifts could lead to the displacement of large numbers of people because the zones where specific crops can grow are likely to change. Animal and plant species that cannot adapt rapidly to the changes will disappear. Higher temperatures also will lead to stronger tornados and hurricanes, because these storms are powered by warm, rising air (see Figure 1.24). An example is Sandy, the unusually large and powerful hurricane that struck the Atlantic Coast of North America in the autumn of 2012. In some areas, drought and water scarcity may also become more common since higher temperatures increase water evaporation rates from soils, vegetation, and bodies of water. Another effect of global warming is likely to be a shift in ocean currents. The result would be more chaotic and severe or dry weather, especially for places where climates are strongly influenced by ocean currents, such as western Europe (see “Vegetation and Climate” in Chapter 4).
Thinking Geographically
After you have read about vulnerability to climate change, you will be able to answer the following questions:

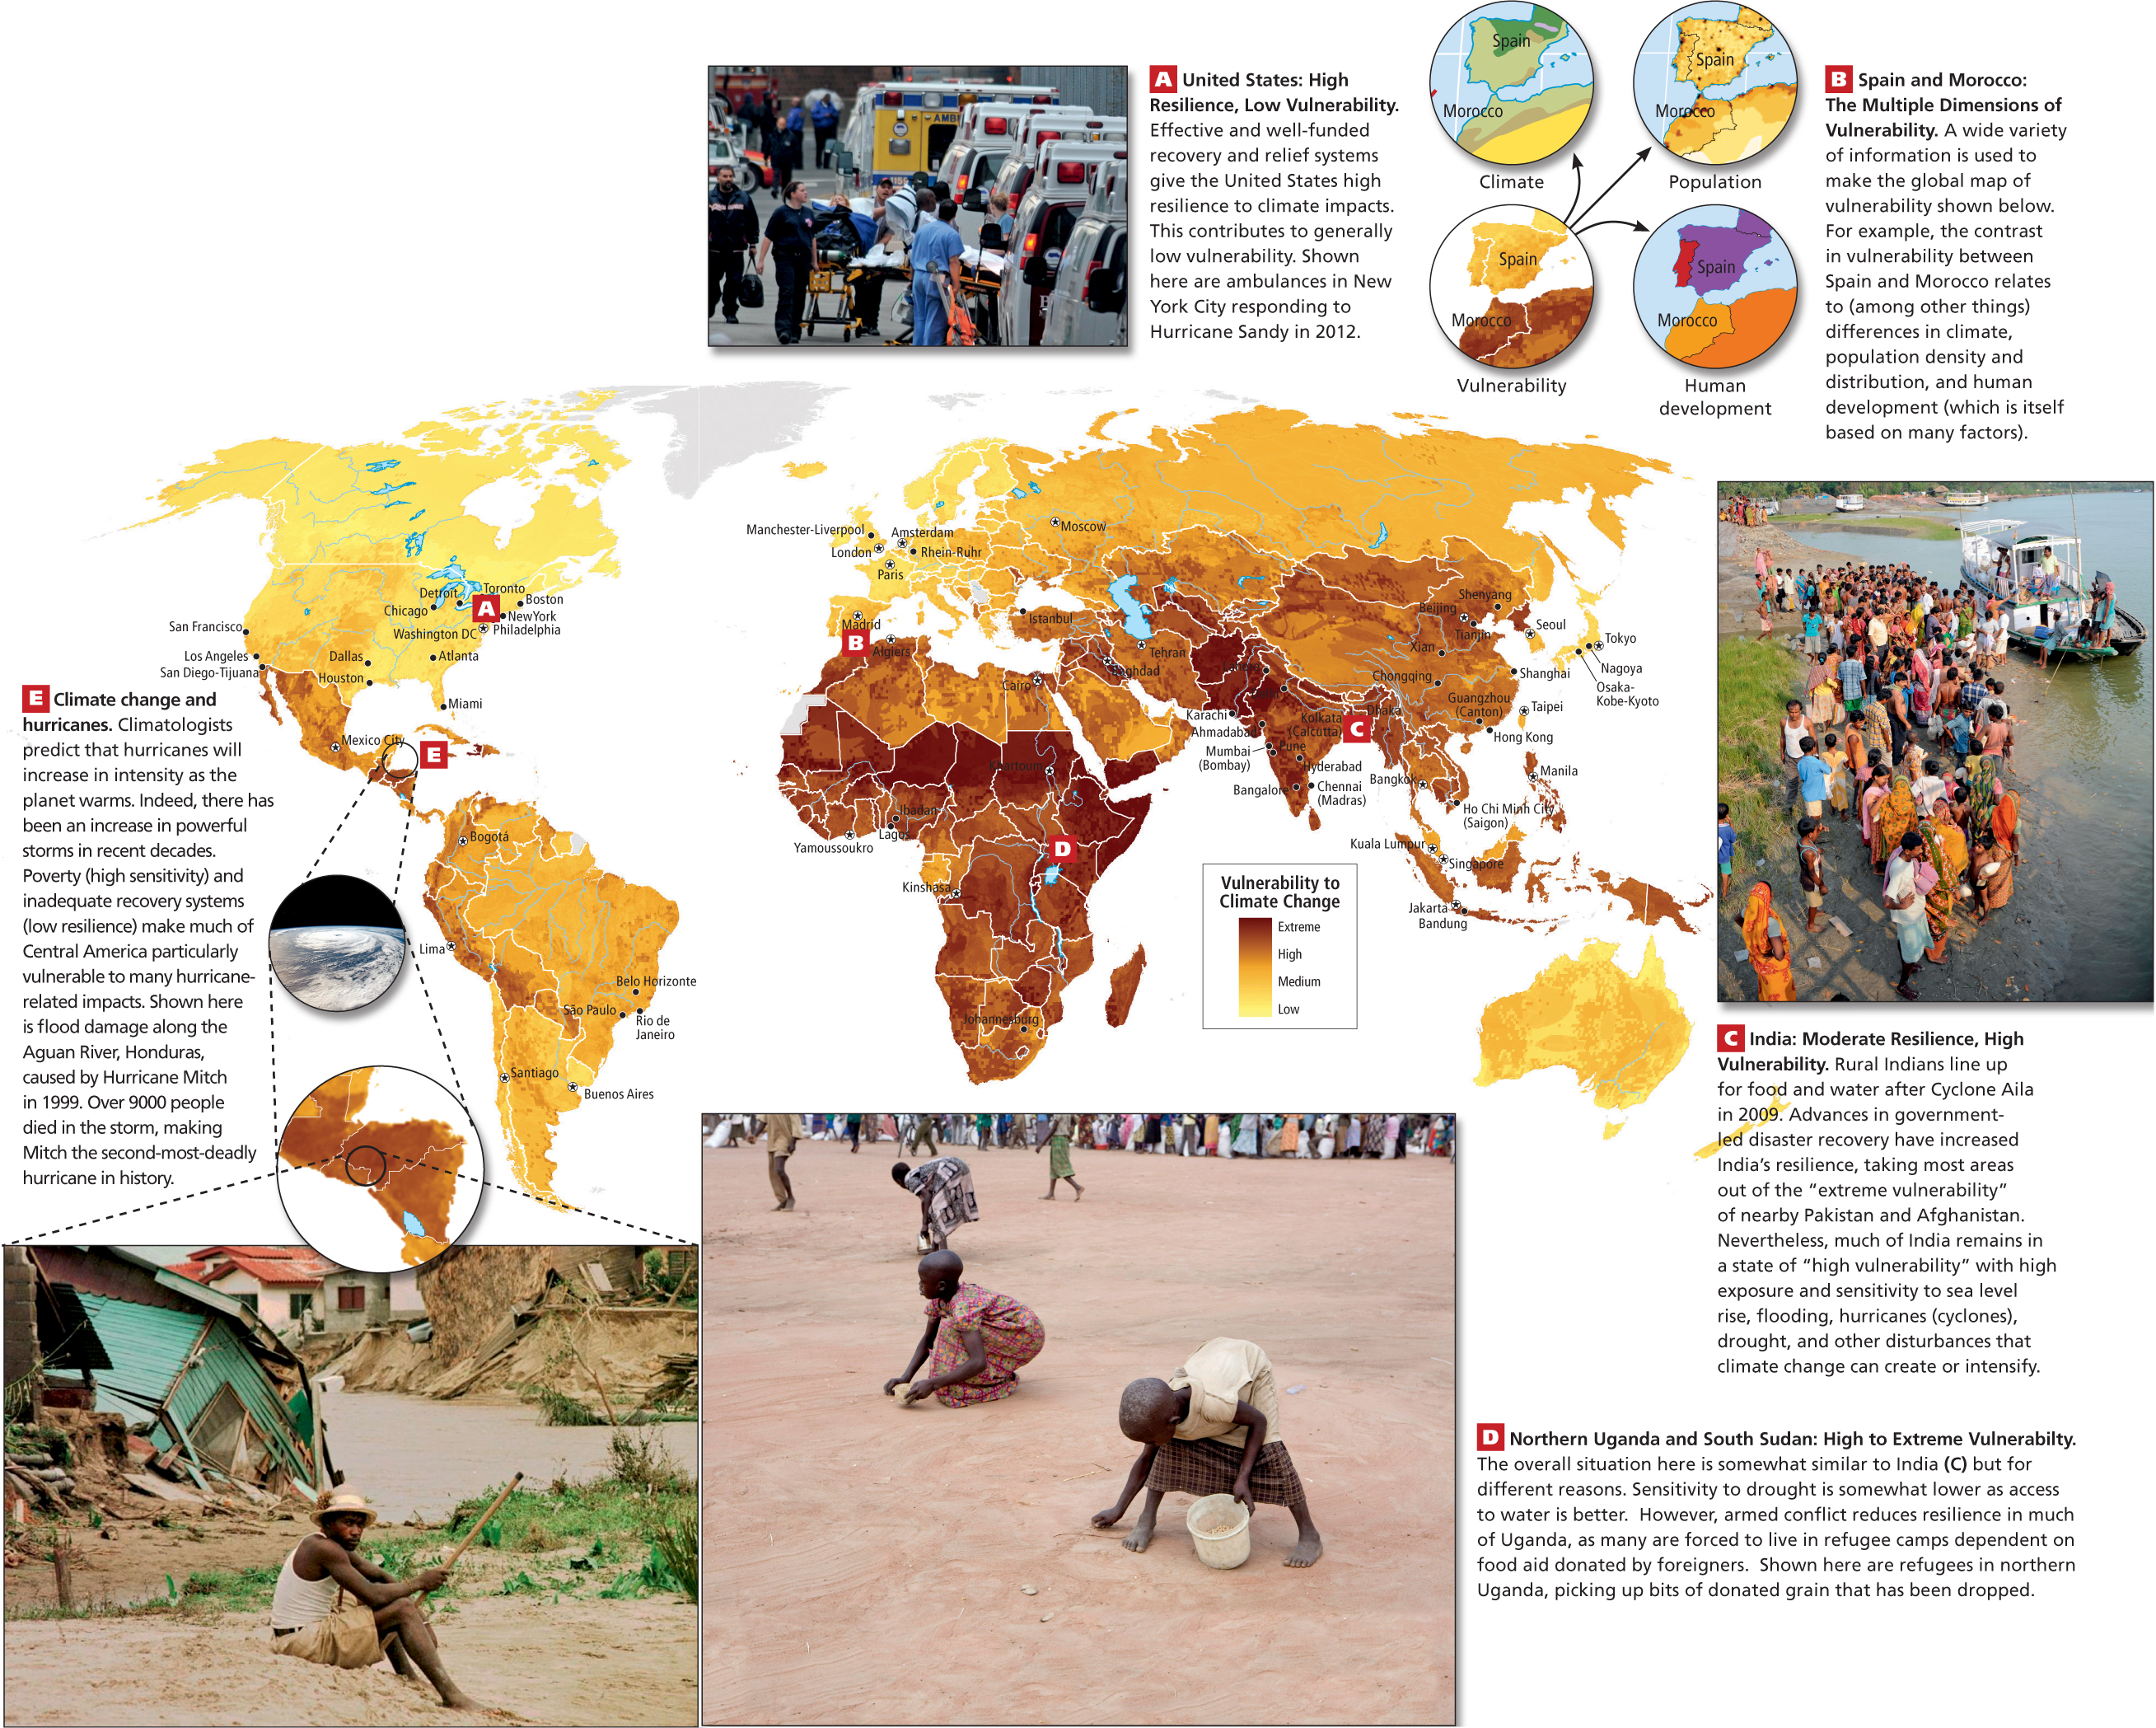
Question
(Photo A) Does this photo relate most to short-term or long-term resilience?
A. B. C. D. 
Question
(Photo B) Of the four thumbnail maps in this graphic, which depicts the information that best explains that the Iberian Peninsula is so much less vulnerable to climate change than is North Africa?
A. B. C. D. 
Question
(Photo C) What sign of an orderly response to disaster is visible in this picture?
A. B. C. D. 
Question
(Photo D) How can you tell that food supplies are low in this camp?
A. B. C. D.
Vulnerability to Climate Change
Geographic Insight 7
Climate Change and Water: Water and other environmental factors often interact to influence the vulnerability of a location to the impacts of climate change. These vulnerabilities have a spatial pattern.
A place’s vulnerability to climate change can be thought of as its risk of suffering damage to human or natural systems as a result of such impacts as sea level rise, drought, flooding, or increased storm intensity. Some of these vulnerabilities are water related; others are not. Scientists who study climate change agree that while we can take measures to minimize temperature increases, we can’t stop them entirely, much less reverse those that have already occurred. We are going to have to live with and adapt to the impacts of climate change for quite some time. The first step in doing this is to understand how and where humans and ecosystems are especially vulnerable to climate change.
A Case Study of Vulnerability: Mumbai, India
Three concepts are important in understanding a place’s vulnerability to climate change: exposure, sensitivity, and resilience. Here we explore them in the context of the vulnerability to water-related climate-change impacts in Mumbai, India.
Exposure refers to the extent to which a place is exposed to climate-change impacts. For example, a low-lying coastal city like Mumbai, India (see Figure 8.1), is highly exposed to sea level rise. Sensitivity refers to how sensitive a place is to those impacts. For example, many of Mumbai’s inhabitants are very sensitive to sea level rise because they are extremely poor and can only afford to live in low-lying slums that have no sanitation and thus whose nearby waterways are polluted. Flooding of these waterways would spread epidemics of waterborne illness that could kill many. Resilience refers to a place’s ability to “bounce back” from the disturbances that climate-change impacts create. Mumbai’s resilience to sea level rise is bolstered by the paradox that, despite its widespread poverty, it is the wealthiest city in South Asia. This wealth enables it to afford relief and recovery systems that could help it deal with sea level rise over the short and long term. Over the short term, Mumbai benefits from more and better hospitals and emergency response teams than any other city in South Asia. Over the long term, Mumbai’s well-trained municipal planning staff can create and execute plans to help sensitive populations, like people living in slums, adapt to sea level rise. This could be achieved, for example, through planned relocation to higher ground or by building sea walls and dikes that could keep sea waters out of low-lying slum areas. Of course, Mumbai’s overall vulnerability is more complicated than these examples suggest because the city faces many more climate-change impacts than just sea level rise. However, these examples help us understand vulnerability to climate change as a combination of exposure, sensitivity, and resilience.
One effort at understanding the global pattern of vulnerability to climate change can be seen in Figure 1.24, which features a map of vulnerability to climate change and photos of the types of problems that are already observable (see Figure 1.24A, C–E). The pattern of greatest vulnerability involves all of the world regions that have the lowest human development. This reflects the reality that both sensitivity and resilience are related to the many factors that influence human development. For example, many of the qualities that make Mumbai more sensitive to sea level rise are less present in urban areas located in highly developed countries. New York City has virtually none of the large, unplanned lowland slums found in Mumbai. In addition, numerous world-class hospitals, emergency response teams, plus large and well-trained municipal planning staffs boost New York’s resilience. Nonetheless, Hurricane Sandy showed that even highly resilient areas, such as the New York City metropolitan area, can suffer overwhelming devastation. 
Responding to Climate Change
Kyoto Protocol an amendment to a United Nations treaty on global warming, the Protocol is an international agreement, adopted in 1997 and in force in 2005, that sets binding targets for industrialized countries for the reduction of emissions of greenhouse gases
In Copenhagen in December 2009, 181 countries attempted to halt the rising concentrations of CO2 in the atmosphere by 2020. However, wealthy nations did not offer to curb emissions sufficiently enough to make a difference. The only progress that came out of Copenhagen was an agreement to help developing countries achieve clean-energy economies and otherwise adapt to climate change; but even for this, adequate funds were not allocated.
In December 2011, the UN Framework Convention on Climate Change (UNFCCC) convened, this time in Durban, South Africa, again with the goal of significant emission control. After grueling negotiations, all 190 countries, including the top three emitters—China, the United States, and India—agreed to a plan to cut emissions significantly by 2020. But was this sufficient progress? According to climate scientists and those who are vulnerable to the effects of climate change, 2020 is too late to begin significant changes. Rather, to avoid a temperature rise above 2°C, carbon emissions would need to be in decline well before 2020 and the language of the agreements would need to be far more ironclad. As of 2012, a consortium of scientists, known as Yale Environment 360, acknowledged that there has been no appreciable improvement in CO2 emission control (see “Thinking the Unthinkable: Engineering Earth’s Climate,” at http://tinyurl.com/73txae7).
THINGS TO REMEMBER
- Planet Earth is continually undergoing climate change—a slow shifting of climate patterns that results from general cooling or warming of the atmosphere.
- Human activities that emit large amounts of carbon dioxide, methane, and other greenhouse gases are trapping heat in the atmosphere, causing what is now widely recognized as global warming.
- Geographic Insight 7Climate Change and Water Many climate-change impacts are water related, such as glacial melting, flow levels in rivers, sea level rise, drought, and flooding. This makes it crucial to understand how places are vulnerable to climate impacts.
- There has been little progress in creating global agreement on controlling CO2 emissions.