Sociocultural Issues
North American attitudes about urbanization, immigration, race, ethnicity, and religion are changing rapidly, with some embracing change and others resisting it. Shifting gender roles are redefining the North American family, and an aging population is raising new concerns about the future.
Urbanization and Sprawl
A dramatic change in urban spatial patterns has transformed the way most North Americans live. Since World War II, North America’s urban populations have increased by about 150 percent, but the amount of land they occupy has increased almost 300 percent (Figure 2.21). This is primarily because of suburbanization and urban sprawl, companion processes to urbanization.
Thinking Geographically
After you have read about urbanization in North America, you will be able to answer the following questions:
Question
eEk1f/OzBCV3TWbAAKzROp3sG02upJvVvgaRMwSL8Z0wZjECCiRlbH9GbkG+uaPYe8FQoqs5prRMj0zX/dOESggCihP6GI9nl/m5d5gn5jvTi22x6wpI0wtM+X83e5neSaRkwp/eJ7eFq3u6wd8hzzOUYZIvJNM7jUpqicBq57dvLtaHhtW8ffCsOCQoDyJtNK24+WM5GfO2GOlvpu0FHC61E9grqv3uKfeIs29TSVdDmhwE+l7c8jBqwt+WngqrolOkk4/7Gm+XOIRx5hdMA9UGIsMns94wF9OCCEVNTKBtLcBzvQHRvv5bdTe02QzMvLlmQKwNPIkDGYaP4N2Va1VIYktKO2bmnvnenRJ8Qlt+V7M8oj8UuZ5lJ3HWiNHbhstW52y4cbfuTRcBDKCuxPPezd3t+M4UyU2/c9S+LH9qNsLn46lOLEyxbP3KAWcELzPqf4T5rn1p+eWits4OrfLxGfXyUhmkSuWEnI6roxsopbDnnPZId0w6B7iieucqrOc8bZvF1Fc3OWRD8IfqKbh7qaeOQumC7loKfJSZKKWSCJHwVM0NUJeqJGF9T2trGt1PbRrL8sVc9xmYS75wtn2rzQhvmd/bvMVZ00fPuTOYVnuf1+Axxl65Ga0h+b1ZBm0R1W57MtfSX3e9394bQeBFQwT8zlyRssf5w2DiW+nZXhjV1A7f5wsSeifQLvsYNiqJMNKmH5phu7POfELc61431hHf/trqJXQdSqRjU4N0ZI6EyBpofIRVeCk=Question
EhtAD3v+kaClq4l+Y6Zfd1k+fClnALtMfax6ywfoqJGmfhxDiybTLl4oX484zdQdSU8xC8TxwLGQLfFaiE3JP0Aykj50NrSgJ+/uAR0T3thPgbNfweoypYyQBaPx3YHFDvwj9oAdE6fAaIiAF75mjaSGCwRCdONIjJgJD9i86BZy/0OknUlyVBWxshbmYZSMPjnpmpRVDAEPbi+AgETz+vXjifATpLcwJM/zuaPFzBFGU3PVcG6cM0oV+iRb0fLGBQ3FZulagKqfNICiR80IUeQfLGwHqwN7fr6ghxqNOH56/xJdDokQRa4UHftJpCA0J8uvJP4+7G/OSdWJadI+y/7Nqst5Tw6QDgpm/JN1X+5k9JPdqqrIywEa0U3nb9+bCtaQQuQ6cS4qRK8QQu+yCA==Question
gYD04zFKdro837gZUsSkTvuAARLOmWBamwL58aCDtMd68hqR9dQs0sKBGyFfGLscYK2+TReQ3UUwBrz/l+en8XVmwZBeQVaJ/B36wsyC5TeKtjY1snts2j7fDIkfYMfbMj2jHniLt81IANJPZmXQ/zAITBLZ4yBTcHZX3RmWDUK/IDra/V00iPQFmMkaK1fSepV5+nmBXQBduBNvhoa8pnIW+tZmIVlSgcm2iTxP3H+SDUSgLbLUnY9iFf5Ha0cvjpJLsPthgrmX3B5ZIUBo7lWy3S2W5ah4RuiotJ97LDN+Gisjj/TZguJbTe8U1DIp5eovHlZM9XDfb0GIbFEn3U4uIRpUuPSpk23O6pxrXnminS0vykj1YjFmLRMEoO0gOq9WTXqaO4sFV6m+jDZUVUV/hI3U9HnZViyCXwcBF2EjB4nmgKKjPurMGxDCtmZGthyzqRCEakrSeo6fAPtu1DSFpPaGSVk+6hjkWU8fARRNcOB7svFuUnek6fgYeIavuRJVJAh6ViSNDgzVQuestion
bkfus3qtbfNQuz1kr2ptl5l90NVL0VmCmEtaaaG7pIVwdEcmP1+vC7qDdtwWgwNPpNXjV5gy/eROrbye8MIx1FFmPLKT2LyZ3grbph9/nb4GQcT2X5OFV1Kky+2ta1AhId5cG8bDmclBqnX10hO0SMjALtYOlDpOEzCmWWICW9hnWED/ewXtKbdCk89zgiuvDfGixnnjRui+Rzz/lT/m6XoAuUalz/uQinda6rETlU/m2FIXkrE46hjHW9TL/3m7sh895v22pZu9Y2PqQJM96OFiqlWJ6+S5Ppuk1L0+NLhDRNfY+rUQ65/u+r4FhQuPPSDtmujLimgr8kZlTUFFnHEDXNQYs9d+Jxg2H4bVgiaLPAPPXtJ7z36ActgyddZv/B4rmgymxA6lWkLZ0zlkUbuTqpSCIwVh1xzuHZZb+BosdoUFQ2kWUbNzoGU0sTQo6fgalDdZvtP1tUXI7LUt3Rg7wVAtIYA/IVsRGCeRh28daBSwYJF5TDtxdbsivlsv907Bsb5+vC0=90
91
Today, close to 80 percent of North Americans live in metropolitan areas—cities of 50,000 or more, plus their surrounding suburbs and towns. Most of these people live in car-dependent suburbs built since World War II, where urban life bears little resemblance to that in the central cities of the past.
metropolitan areas cities of 50,000 or more and their surrounding suburbs and towns
In the nineteenth and early twentieth centuries, cities in Canada and the United States consisted of dense inner cores and less-dense urban peripheries that graded quickly into farmland. Starting in the early 1900s, central cities began losing population and investment, while urban peripheries—the suburbs—began growing. Workers were drawn by the opportunity to raise their families in single-family homes in secure and pleasant surroundings on lots large enough for vegetable gardens. Some continued to work in the city, traveling to and from on streetcars. After World War II, suburban growth dramatically accelerated as cars became affordable to more workers (Figure 2.22). With the growing popularity of the family car, interest in publicly funded transport for spreading urban areas was reduced to city bus systems. Retrofitting highly developed urban areas such as Atlanta or San Francisco with light rail systems or subways has proven to be very expensive.
suburbs populated areas along the peripheries of cities
As North American suburbs grew and spread out, nearby cities often coalesced into a single urban mass. The term megalopolis was originally coined to describe the 500-mile (800-kilometer) band of urbanization stretching from Boston through New York City, Philadelphia, and Baltimore, to south of Washington, DC. Other megalopolis formations in North America include the San Francisco Bay Area, Los Angeles and its environs, the region around Chicago, and the stretch of urban development from Eugene, Oregon, to Vancouver, British Columbia.
megalopolis an area formed when several cities expand so that their edges meet and coalesce
This pattern of urban sprawl requires residents to drive automobiles to complete most daily activities such as grocery shopping or commuting to work. Increasing air pollution and emission of greenhouse gases that contribute to climate change are two major side effects of the dependence on vehicles that comes with urban sprawl. Another important environmental consequence is habitat loss brought about by suburban development expanding into farmland, forests, grasslands, and deserts.
Farmland and Urban Sprawl
Urban sprawl drives farmers from land that is located close to urban areas, because farmland on the urban fringe is very attractive to real estate developers. The land is cheap compared to urban land, and it is easy to build roads and houses on since farms are generally flat and already cleared. As farmland is turned into suburban housing, property taxes go up and surrounding farmers who can no longer afford to keep their land sell it to housing developers. In North America each year, 2 million acres of agricultural and forest lands make way for urban sprawl.
Advocates of farmland preservation argue that beyond food and fiber, farms also provide economic diversity, soul-soothing scenery, and habitat for some wildlife. For example, the town of Pittsford, New York (a suburb of Rochester), decided that farms were a positive influence on the community. Mark Greene’s 400-acre, 200-year-old farm lay at the edge of town. As the population grew, the chances of the farm remaining in business for another generation looked dim. Land prices and property taxes rose, and the Greene family could not meet their tax payments. Residents in the new suburban homes, sprouting up on what had been neighboring farms, pushed local officials to halt normal farm practices, such as noisy nighttime harvesting or planting, spreading smelly manure, or importing bees to pollinate fruit trees. Pittsford, however, decided to stand by the farmers by issuing $410 million in bonds so that it could pay Greene and six other farmers for promises that they would not sell their 1200 acres to developers, but would instead continue to farm them.
92
VIGNETTE
For Canada’s First Nations people (the preferred term in Canada for Native Americans), the chance to indulge in the extravagance of urban sprawl is viewed positively. The Tsawwassen First Nation is one of 630 native groups that are negotiating with the Canadian government to gain full control over their ancestral territories. The land they recently received by a treaty lies 20 miles south of Vancouver, near the Strait of St. George. Eager to finally enjoy some of the fruits of development, they are planning a 2-million-square-foot “big box” and indoor shopping mall in the midst of what has been rural farmland. The surrounding communities, which had long shielded their village-like settlements against urban sprawl, feel that there are enough shopping opportunities already. The Tsawwassen see the mall as a long-overdue chance for the prosperity that their neighbors already enjoy. [Source: Adapted from The Atlantic Cities. For detailed source information, see Text Credit pages.]
Smart Growth and Livability
The term smart growth has been coined for a range of policies aimed at stopping sprawl by making existing urban areas more “livable.” Livability relates to factors that lead to a higher quality of life in urban settings, such as safety, good schools, affordable housing, quality health care, numerous and well-maintained parks that offer recreational opportunities for people and their pets (Figure 2.23), and well-developed public transportation systems. Some indexes of livability for major cities worldwide are put out every year by The Economist magazine and the Mercer Quality of Living Survey.

2.23a Courtesy Education Images/UIG via Getty Images, 2.23b Courtesy Kasia Wandycz/Paris Match via Getty Images, 2.23c Courtesy Yuri Yuriev/AFP/Getty Images
In smart growth planning, environmental benefits are envisioned as well. The focus on life lived locally, where mass transit and walking replace the family car, and where gardening for food is a community entertainment, will result in lower energy use, air pollution, and CO2 emissions. While smart growth and the shift toward livability are just starting to take hold throughout North America, there are a few cities, such as Vancouver, British Columbia (see Figure 2.21A), and Portland, Oregon, where these principles are much further along in implementation.
Some older cities are enjoying a renaissance as people move back to them in search of the greater livability. Places like New York City are arguably the furthest along in crucial aspects of smart growth, given their high density and widespread use of mass transit (see Figure 2.21B). However, the high cost of living in these places can reduce their livability.
It may be a while before smart growth and livability make much of an impact in North America’s fastest-growing cities, such as Atlanta, Dallas, and Las Vegas. Here, in recent years, vast car-dependent suburbs have spread over enormous areas. Not surprisingly, none of these cities ranks high on livability indexes (see Figure 2.21C). Car dependence and rapid growth have brought Atlanta massive traffic jams and some of the worst air quality in the United States (see Figure 2.21D). Meanwhile, livability in the Las Vegas metro area is reduced by poor air and water quality as well as high crime rates.
93
Inner-city decay is another impact of sprawl on livability. This is especially true in the United States, where many inner cities are dotted with large tracts of abandoned former industrial land and neighborhoods debilitated by persistent poverty and loss of jobs. Old industrial sites that once held factories or rail yards are called brownfields. Because they are often contaminated with chemicals and covered with obsolete structures, blacktop, and concrete, they can be very expensive to redevelop for other uses. Also left behind in the inner cities are the least-skilled and least-educated citizens, many of whom were drawn in generations ago by the promise of jobs that have long since moved out to the suburbs or overseas. Often the majority population in these inner cities is a mixture of African Americans, Asians, Hispanics, and new immigrants. Some are relatively affluent and are leading efforts to renew old city centers. Others are in great need of the very services—health care, schools, and social support (including churches, synagogues, and mosques)—that have moved to the suburbs.
brownfields old industrial sites whose degraded conditions pose obstacles to redevelopment
The new emphasis on smart growth and livability has also reinforced the gentrification of old, urban residential districts. As affluent people invest substantial sums of money in renovating old houses and apartments, poor inner-city residents can be displaced in the process. The effect of gentrification on the displaced poor appears to be somewhat less harsh in Canada than in the United States, primarily because Canada’s stronger social safety net better ensures social services, housing, and help with housing maintenance. Some U.S. cities (for example, Knoxville, Tennessee; Portland, Oregon; and Charlotte, North Carolina) have initiated New Urbanism projects for inner-city residents displaced by gentrification. These projects aim to rehouse people in pleasant, newly built, walkable urban neighborhoods with conveniently located services (Figure 2.24).
gentrification the renovation of old urban districts by affluent investors, a process that often displaces poorer residents

Immigration and Diversity
Immigration has played a central role in populating both the United States and Canada. Most people in North America descend from European immigrants; but there are many who have roots in Africa, Asia, Middle and South America, and Oceania. New waves of migration from Middle and South America and parts of Asia promise to make North America a region where people of non-European or mixed descent will become the majority (Figure 2.25). Most major North American cities are already characterized by ethnic diversity, and in some, recent immigration has led to near majorities of foreign-born residents. Houston, Texas, for example, was the most ethnically diverse metropolitan area in the United States in 2010, with 40 percent of the population Anglo, 36.7 percent Latino, 16.8 percent African American, and 6.5 percent Asian.  50. IMMIGRATION AND POPULATION REPORT
In the United States, the spatial pattern of immigration is also changing. For decades, immigrants settled mainly in coastal or border states such as New York, Florida, Texas, or California. However, since about 1990, immigrants are increasingly settling in interior states such as Illinois, Colorado, Nevada, and Utah (see Figure 2.25). The influence of immigrants can also be seen in many aspects of life in North America, including the popularity of ethnic cuisines (Figure 2.26).

2.26a Courtesy Scott Olson/Getty Images, 2.26b Courtesy Christinne Muschi/Toronto Star via Getty Images, 2.26c Courtesy Andrew McKinney/Dorling Kindersley/Getty Images
Why Do People Decide to Immigrate to North America?
The decision to leave one’s homeland is usually not an easy one. There are almost always push factors that cause people to consider the drastic move of leaving family, friends, and familiar places to strike out into the unknown, with what are usually limited resources. These push factors can be civil or political unrest, or some kind of discrimination, but most often it is lack of economic opportunity and curbs on upward mobility that overcome the natural resistance to leaving home. Recently, the forces of globalization have often been the root cause of these push factors. For example, when NAFTA encouraged large U.S. agribusinesses to relocate to Mexico to grow corn on a massive scale, small Mexican corn farmers were dislodged from land they had traditionally worked; others found they could not compete on price and had to give up farming. Yet all these farmers had families to feed and educate, so often fathers and their brothers and sons migrated north in search of work. In Texas, California, or Tennessee, they worked in construction or as field laborers, lived frugally, and sent most of their earnings home. Some entered the United States legally, but many—because of the complexities and costs of getting papers to immigrate—entered illegally. Legal U.S. immigration visas are available in far fewer numbers than both the potential immigrants and the jobs available for them to fill.
push factors factors that get people to consider the drastic move of leaving family, friends, and a familiar place to strike out into the unknown, with what are usually unknown resources
94
Do New Immigrants Cost U.S. Taxpayers Too Much Money?
Many North Americans are concerned that immigrants burden schools, hospitals, and government services. And yet numerous studies have shown that, over the long run, immigrants contribute more to the U.S. economy than they cost. Legal immigrants have passed an exhaustive screening process that assures they will be self-supporting. As a result, most start to work and pay taxes within a week or two of their arrival in the country. Those immigrants, who draw on taxpayer-funded services such as welfare, tend to be legal refugees fleeing a major crisis in their homeland; they are dependent only in the first few years after they arrive. More than one-third of immigrant families are firmly within the middle class, with incomes of $45,000 or more. Even undocumented (illegal) immigrants play important roles as payers of payroll taxes, sales taxes, and indirect property taxes through rent. Because they fear deportation, illegal immigrants are also the least likely to take advantage of taxpayer-funded social services, such as food stamps or subsidized housing.
95
On average, immigrants are healthier and live longer than native U.S. residents, according to a 2004 study by the National Institutes of Health (NIH). Thus they represent less drain on the health care and social service systems than do native residents. The NIH attributes this difference to a stronger work ethic, a healthier lifestyle that includes more daily physical activity, and the more nutritious eating patterns of new residents compared to those of U.S. society at large. Unfortunately, these healthy practices tend to diminish the longer immigrants are in the country, and the more healthy status does not carry over to immigrants’ children, who are nearly as likely to suffer from obesity as native-born children.
Do Immigrants Take Jobs Away from U.S. Citizens?
The least-educated, least-skilled American workers are the most likely to end up competing with immigrants for jobs. In a local area, a large pool of immigrant labor can drive down wages in fields like roofing, landscaping, and general construction. Immigrants with little education now fill many of the very-lowest-paid service, construction, and agricultural jobs.
It is often argued that U.S. citizens have rejected these jobs because of their low pay, which results in immigrants being needed to fill the jobs. Others argue that these jobs might pay more and thus be more attractive to U.S. citizens if there were not a large pool of immigrants ready to do the work for less pay. Research has failed to clarify the issue. Some studies show that immigrants have driven down wages by 7.4 percent for U.S. natives without a high school diploma. However, other studies show no drop in wages at all. Employers across the country speak of the superior work ethic of immigrants, especially in the construction industry, which makes them happy to pay these workers decent wages.
Professionals in the United States occasionally compete with highly trained immigrants for jobs, but such competition usually occurs in occupations where there is a scarcity of native-born people who are trained to fill these positions (Figure 2.27). The computer engineering industry, for example, regularly recruits abroad in such places as India, where there is a surplus of highly trained workers. In this case, it is unclear whether these skilled immigrants are driving down wages. Until the recession caused jobs to be eliminated, it was quite clear that there were not enough sufficiently trained Americans to fill the available positions. In fact, India’s growth in IT jobs and related services has been so impressive that many who came to North America to work in these jobs have elected to go back to India to work in the newly burgeoning IT industry there, a development that has not been welcomed by their American employers.
Are Too Many Immigrants Being Admitted to the United States?
Many people are concerned that immigrants are coming in such large numbers that they will strain resources here. This point of view has some credibility. Immigrants and their children accounted for 78 percent of the U.S. population growth in the 1990s. At this rate of entry, by the year 2050, the U.S. population is projected to reach 422.6 million (down 20 million from estimates in 2008), with immigration accounting for the majority of the increase. But one of the problems with making these projections is that no one really knows how much undocumented (illegal) immigration there really is. Most research indicates that it has reached unprecedented levels over the past 30 years, possibly exceeding legal immigration rates since the mid-1990s. While estimates of the illegal immigrant population currently in the United States range from 7 to 20 million, reports in 2012 indicated that migration—legal and illegal—was down to less than half of previous years.
Undocumented immigrants tend to lack skills, and they are not screened for criminal background, as are all legal immigrants. However, research also shows that undocumented migrants are not only less likely to partake of social services, but also less likely to participate in criminal behavior than the general population, with only tiny percentages of them having committed offenses. Further analysis of the 2010 census will help researchers formulate factually based positions on these issues.
96
47. AMERICAN CENSUS REPORT
51. IMMIGRATION LABOR SHORTAGE REPORT
Research shows that the decision to migrate without legal documentation is a very difficult one, undertaken because of severely limited economic, educational, and social opportunities at home. Few Americans are aware that children of all ages get caught up in these migration patterns, and their migratory experiences remain largely unrecorded. Yet, despite tougher border security and declining adult immigration nationally and internationally, the numbers of unaccompanied children stopped at the border continually increases, illustrating yet one more of the complexities of immigration.
VIGNETTE
Every youth who arrives at the border detention shelter in Arizona writes a life story in a creative writing class. A 14-year-old indigenous girl from Honduras started hers: “At 10-years-old, my papa started to tell me the good things and the bad things.” The next day, the teacher asked what this meant. After sitting in silence for 30 minutes, the girl wrote: “While my father is a good man, he did not always do good things. Some of these things created a bad situation for me.” Afraid to tell her mom, she called her brothers to help her escape.
Three years before, at the peak of the global recession, her then-teenage brothers, unable to find work in their rural area, decided to take the month-long journey to the United States by jumping trains through Mexico and then walking for days across the mountainous and arid terrain of Texas. Once out of Texas, they found migrant farm work in Southern states. The brothers were working in Florida when they spoke to their sister on the phone.
Within days, the brothers sent their sister all of their savings—$8000—and arranged for a coyote to accompany the girl to the United States. As an unaccompanied and attractive female, she was more vulnerable to exploitation, abuse, and sex trafficking. Like most detained in the border shelter, she is unwilling to discuss what happened on her journey, describing it as “the necessary suffering to become someone.” Luckily, she made it without falling victim to drug trafficking and fatal gang violence along the border.
In the 2 months it took her to arrive, she lost contact with her brothers. Lacking family contacts and money, her deportation is likely. Her biggest desire is “to work hard and give the money back to my brothers.” If she is allowed to stay, her brothers will expect her to work to help pay the bills. [Source: Material for this vignette was pieced together by Lydia Pulsipher in April 2012 from personal correspondence with Elizabeth Kennedy and Stuart Aitken, geographers who participate in the ISYS Unaccompanied Minors project.]
Race and Ethnicity in North America
Despite strong scientific evidence to the contrary, people across the world still perceive skin color and other visible anatomical features to be significant markers of intelligence and ability. This racialized view of skin color is partially a remnant of European colonialism, which was based on assigning some to a perpetually low status, while others were given privilege. As discussed previously (see Chapter 1, pages 54–56), the science of biology tells us there is no scientific validity to such assumptions and practices. The same is true for ethnicity, which is the cultural counterpart to race, in that people may ascribe overwhelming (and unwarranted) significance to cultural characteristics, such as religion, family structure, or gender customs. Thus, race and ethnicity are very important sociocultural factors not because they have to be, but because people make them so.
ethnicity the quality of belonging to a particular culture group
Extending Equal Opportunity
Numerous surveys show that a large majority of Americans of all backgrounds favor equal opportunities for minority groups. Nonetheless, in both the United States and Canada, many middle-class African Americans, Native Americans, and Hispanics (and to a lesser extent, Asian Americans) report experiencing both overt and covert discrimination that affects them economically as well as socially and psychologically. And indeed, even a cursory examination of statistics on access to health care, education, and financial services shows that, on average, Americans have quite unequal experiences based on their racial and ethnic characteristics.
Diversity is increasing across North America, and acceptance of diversity as the norm is increasing as well; take, for example, the enthusiasm with which various cultural festivals are attended by Americans regardless of their ethnic heritage (Figure 2.28). Nonetheless, the issue of race remains important in both the United States and Canada, where whiteness is considered the norm and African Americans, Native Americans (First Nations people in Canada), and Hispanics often find themselves defined as exceptions to the norm. Prejudice has clearly hampered the ability of these three groups to reach social and economic equality with Americans of other ethnic backgrounds. In the United States, and to a considerably lesser degree in Canada, despite the removal of legal barriers to equality, these groups (with the notable exception of Asians) still have higher poverty rates and thus lower life expectancies, higher infant mortality rates, lower levels of academic achievement, and more unemployment than other groups.

2.28a Courtesy Mario Tama/Getty Images, 2.28b Courtesy David McNew/Newsmakers/Getty Images, 2.28c Courtesy Todd Korol/Sports Illustrated/Getty Images
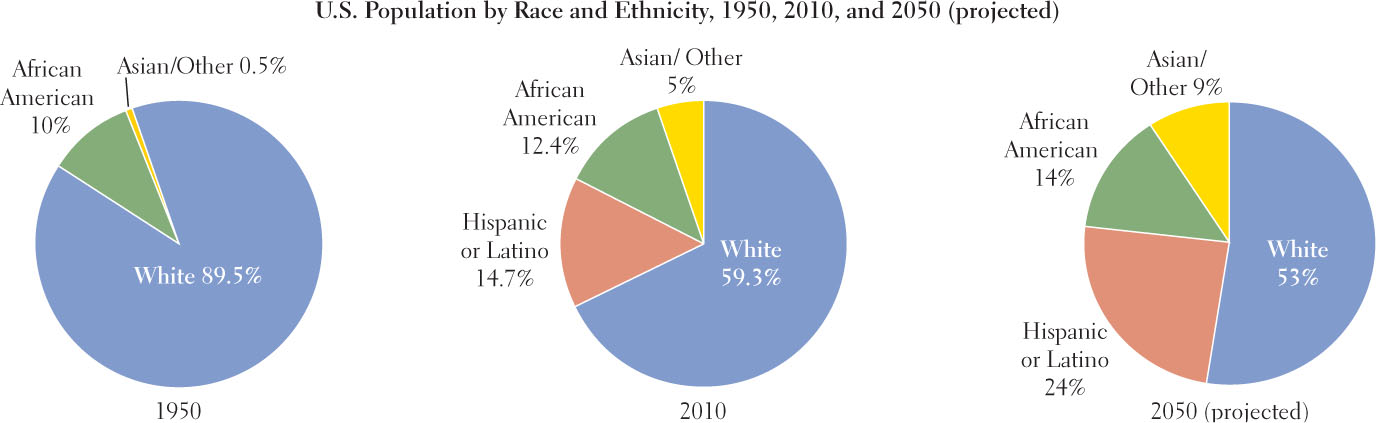
Figure 2.29 shows the changes in the ethnic composition of the North American population from 1950 to 2010, and the projected changes for 2050. In 2001, Hispanics overtook African Americans as the largest minority group in the United States. Because of a higher birth rate and a high immigration rate, the Hispanic population increased by 58 percent in the 1990s, to 14.7 percent of the total population by 2010. By 2010, Asian Americans made up just 5 percent of the U.S. population, but their numbers had increased by 80 percent between 1990 and 2010. Of the foreign-born population in Canada in 1981, Asians made up 14.1 percent and those of European birth, 66.7 percent. Asians appear to be the fastest-growing nonnative-born group in both countries. It is estimated that by 2031, if present trends continue, 55 percent of North Americans who are born abroad will be Asians.
Income Discrepancies
Over the past few decades, many non–Euro-Americans and those of mixed heritage have joined the middle class, achieving success in the highest ranks of government and business. In particular, African Americans have completed advanced degrees in large numbers, and more than one-third now live in the suburbs. Yet, as overall groups, African Americans, Hispanics, and Native Americans remain the country’s poorest and least educated people (Figure 2.30).
97
The Culture of Poverty
Is anything other than prejudice holding back some in these ethnic minority groups? Some social scientists suggest that persistently disadvantaged Americans of all ethnic backgrounds may suffer from a culture of poverty, meaning that poverty itself forces coping strategies that are counter-productive to social advancement. Plans to get higher education, for example, must be abandoned because of lack of funds. This and low social status have bred the perception among those trapped in the culture of poverty that there is no hope and therefore no point in trying to succeed. This perception is perpetuated and even exaggerated by a daily existence on the fringes of American mainstream life. The reality is that these poorest people rarely encounter examples of success, and they have few opportunities to complete a decent education, be hired into jobs with livable wages, or find a decent dwelling.
One component in the culture of poverty is the growing numbers of low-income, single-parent families. In 2005, only 23 percent of Euro-American children and 17 percent of Asian American children lived in single-parent families, while 65 percent of African Americans, 49 percent of Native Americans, and 36 percent of Hispanics did. The reasons for these stark differences are often systemic. For example, many states prohibit or severely limit the amount of income support allowed to intact families who fall on hard times. In these states, it is easier to qualify for welfare if the family is missing one parent. Fathers who lose their jobs may simply absent themselves so the mothers can qualify for assistance. In these situations, children usually stay with their mothers, and fathers often are no longer active in their support and upbringing. This perpetuates the idea that males are not active, participating family members. The assistance packages always fall far short of meeting actual needs, and the enormous responsibilities of both child rearing and breadwinning are often left in the hands of undereducated young mothers who, being in need themselves, are unable to help their children advance.
98
ON THE BRIGHT SIDE
What Class Can Do
Curing poverty may be the answer to lowering racial and ethnic tensions. Evidence for a diminishing of racial and ethnic prejudice is to be found in situations where privileged Americans of any racial background share middle- and upper-class neighborhoods, workplaces, sports teams, places of worship, and marriages. In these cases, the attention paid to skin color and ethnicity decreases markedly.
Another particularly geographic aspect of the culture of poverty is that it is part of a larger problem of economic and social spatial segregation based on class. In both the United States and Canada, the increasingly prosperous middle class, of whatever race or ethnicity, has moved to the suburbs—even to gated residential enclaves. Their children seldom encounter children from poorer families. Those who are successful have difficulty developing empathy for the poor because they know no poor; in turn, the very poor rarely have the chance to associate with models of economic success.
Religion
Because so many early immigrants to North America were Christian in their home countries, Christianity is currently the predominant religious affiliation claimed in North America. In the United States, 76 percent identified themselves as Christian in 2008; in Canada, 70 percent did. In the United States, most Christians are Protestants; in Canada, most are Catholic. Despite the numerical dominance of Christianity, about 15 percent of people in both countries reported no religious affiliation. This group includes atheists, agnostics, and the majority who simply claim no religion by choice. Minority religions are growing in both countries. Virtually every medium-sized city across the region has at least one synagogue, mosque, and Buddhist or Hindu temple. In some localities, adherents of Judaism, Islam, Hinduism, or Buddhism are numerous enough to constitute a prominent cultural influence (see, for example, California and Ontario in Figure 2.31).
Because of the constitutional provisions against the establishment of religion, the U.S. Census Bureau is legally prohibited from collecting data on religious affiliation, so this information is available only from private agencies, many of which have a vested interest in what they report. The Pew Forum on Religion and Public Life (see http://www.pewforum.org) is a reliable source of information and conducts many polls on religious issues.
The Geography of Christian Subgroups
There are many versions of Christianity in North America, and their geographic distributions are closely linked to the settlement patterns of the immigrants who brought them here (see Figure 2.31). Roman Catholicism dominates in regions where Hispanic, French, Irish, and Italian people have settled—in southern Louisiana, the Southwest, and the far Northeast in the United States, and in Québec and other parts of Canada. Lutheranism is dominant where Scandinavian people have settled, primarily in Minnesota and the eastern Dakotas. Mormons dominate in Utah.
Baptists, particularly Southern Baptists and other evangelical Christians, are prominent in the Bible Belt, which stretches across the Southeast from Texas and Oklahoma to the Eastern Seaboard. Evangelical Christianity is such an important part of community life in the South that frequently the first question newcomers to the region are asked is what church they attend.
The Relationship of Religion and Politics
Just how interactive religion and politics should be in North American life has long been a controversial issue in the United States, more so than in Canada. This is true in large part because the framers of the U.S. Constitution, in an effort to ensure religious freedom, supported the idea that church and state should remain separate. In the past three decades, however, many conservative Christians have successfully pushed for a closer integration of religion and public life. Their political goals include banning abortion, promoting prayer in the public schools, teaching the biblical version of creation instead of evolution, and preventing gays and lesbians from participating openly in the public sphere and marrying each other.
New immigrants have brought their own faiths and belief systems, and they are contributing to the debate about religion and public life. Muslims, as yet a tiny minority, have had trouble achieving the same rights as other religious minorities, such as Buddhists or Jews. Some immigrants leave their traditional faith and adopt another. Such is the case with some 15 percent of Hispanic immigrants to the United States who have left the Roman Catholic faith, either while still in their home country or after immigrating, and are now evangelical Christians. In Canada, Catholicism is growing.
99
National surveys have consistently indicated that a substantial majority of North Americans favor the separation of church and state and support personal choice in belief and behavior. However, strident voices for particular points of view are increasingly heard, and the outcome of contentions in North American religious and political life is not yet apparent.
Gender and the American Family
The family has repeatedly been identified as the institution most in need of support in today’s fast-changing and ever more impersonal North America. A century ago, most North Americans lived in large extended families of several generations. Families pooled their incomes and shared chores. Aunts, uncles, cousins, siblings, and grandparents were almost as likely to provide daily care for a child as were the mother and father. Though it has long been present in society, the nuclear family, consisting of a married father and mother and their children, became especially widespread in the post-1900 industrial age.
nuclear family a family consisting of married or common-law parents and their children
The Nuclear Family Becomes a Shaky Norm
Beginning after World War I, and especially after World War II, many young people left their large kin groups on the farm and migrated to distant cities, where they established new nuclear families. Soon suburbia, with its many similar single-family homes, seemed to provide the perfect domestic space for the emerging nuclear family.
This compact family type suited industry and business because it had no firm ties to other relatives and so was portable. Many North Americans born since 1950 moved as many as ten times before reaching adulthood. The grandparents, aunts, and uncles who were left behind missed helping raise the younger generation and had no one to look after them in old age; this separation of older from younger generations is one reason nursing homes for the elderly proliferated.
In the 1970s, the whole system began to come apart. It was a hardship to move so often. Suburban sprawl meant onerous commutes to jobs for men and long, lonely days at home for women. Women began to want their own careers, and rising consumption patterns made their incomes increasingly useful to family economies. By the 1980s, seventy percent of the women born between 1947 and 1964 were in the paid workforce, compared with 30 percent of their mothers’ generation.
100
Once employed, however, a woman could not easily move to a new job location if she had an upwardly mobile husband. Also, working women could not manage all of the family’s housework and child care, as well as a job. Some married men began to handle part of the household management and child care, but the demand for commercial child care grew sharply. With family no longer around to strengthen the marital bond and help with child care, and with the new possibility of self-support available to women in unhappy marriages, divorce rates rose into the mid-1970s, while birth rates fell. Those who married after 1975, however, have had a slowly declining rate of divorce. This may be related to the growing number of couples with college educations, as this group is less likely to divorce.
The Current Diversity of American Family Types
There is no longer a typical American household, only an increasing diversity of household forms and ways of family life (Figure 2.32). In 1960, the nuclear family—households consisting of married couples with children—comprised 74.3 percent of U.S. households. This number declined to 56 percent by 1990 and to 49.3 percent by 2010. Family households headed by a single person (female or male) rose from 10.7 percent in 1960, to 15 percent in 1990, to 18 percent in 2010. Nonfamily households (unrelated by blood or marriage) rose from 15 percent of the total in 1960, to 29 percent in 1990, to nearly 34 percent in 2010. Added to the diversity of family forms is the fact that, increasingly, families in Canada and the United States are multiracial and/or multicultural. Usually this family diversity comes via cross-cultural marriage, and often children from these marriages are biracial. President Obama, for example, with a white North American mother and a black African father, is a biracial American.
While most of these families work well, a few of these new forms may not provide adequately for the welfare of children. In 2006, more than 29 percent of U.S. children lived in single-parent households. Although most single parents are committed to rearing their children well, the responsibilities can be overwhelming.
Children and Poverty in North America
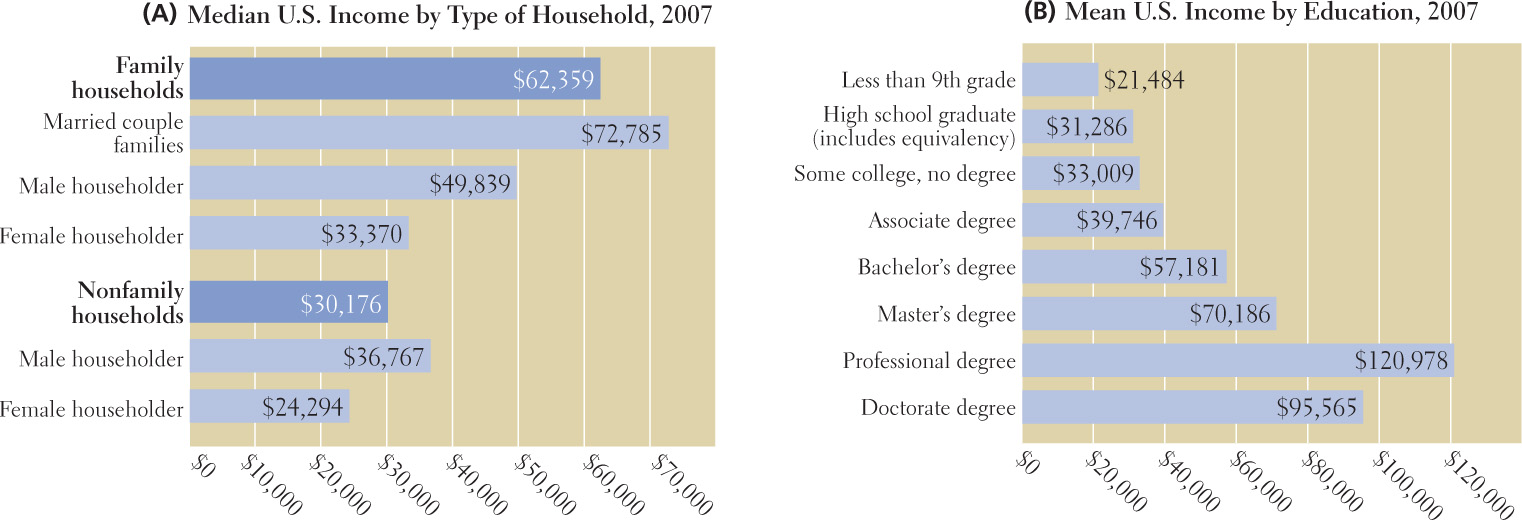
Single-parent families tend to be hampered by economic hardship and lack of education (Figure 2.33). Young women head the vast majority of single-parent households, and their incomes, on average, are less than two-thirds those of single male heads of household. Low income and low levels of education are closely linked, as the graph in Figure 2.33B shows. One result of the pattern of single-parent households having lower education levels and incomes is that children in the United States are disproportionately poor. In 2010 in the United States, 22 percent of children aged 0 to 17 (16.4 million) lived in poverty, whereas only 11.4 percent of adults did. In Canada, 14.2 percent of children were poor. By comparison, in Sweden, just 2.4 percent of children lived in poverty; in Ireland, 12.4 percent; and in Poland, 12.7 percent.
101
THINGS TO REMEMBER
 North America has some of the world’s wealthiest cities, most of which are in the eastern United States. Nearly 80 percent of North Americans now live in metropolitan areas.
- Since World War II, North America’s urban populations have increased by about 150 percent, but the amount of land they occupy has increased almost 300 percent, a phenomenon known as urban sprawl.
- A steady increase in migration from Middle and South America and parts of Asia promises to make North America a region where most people are of non-European descent.
- Statistics on access to health care, education, and financial services by race and ethnicity show that, on average, Americans have quite uneven experiences based on their racial and ethnic characteristics.
- There is no longer a typical American household, only an increasing diversity of household forms.
- A large percentage of children in the United States live in poverty, compared to other developed countries.