General Population Patterns
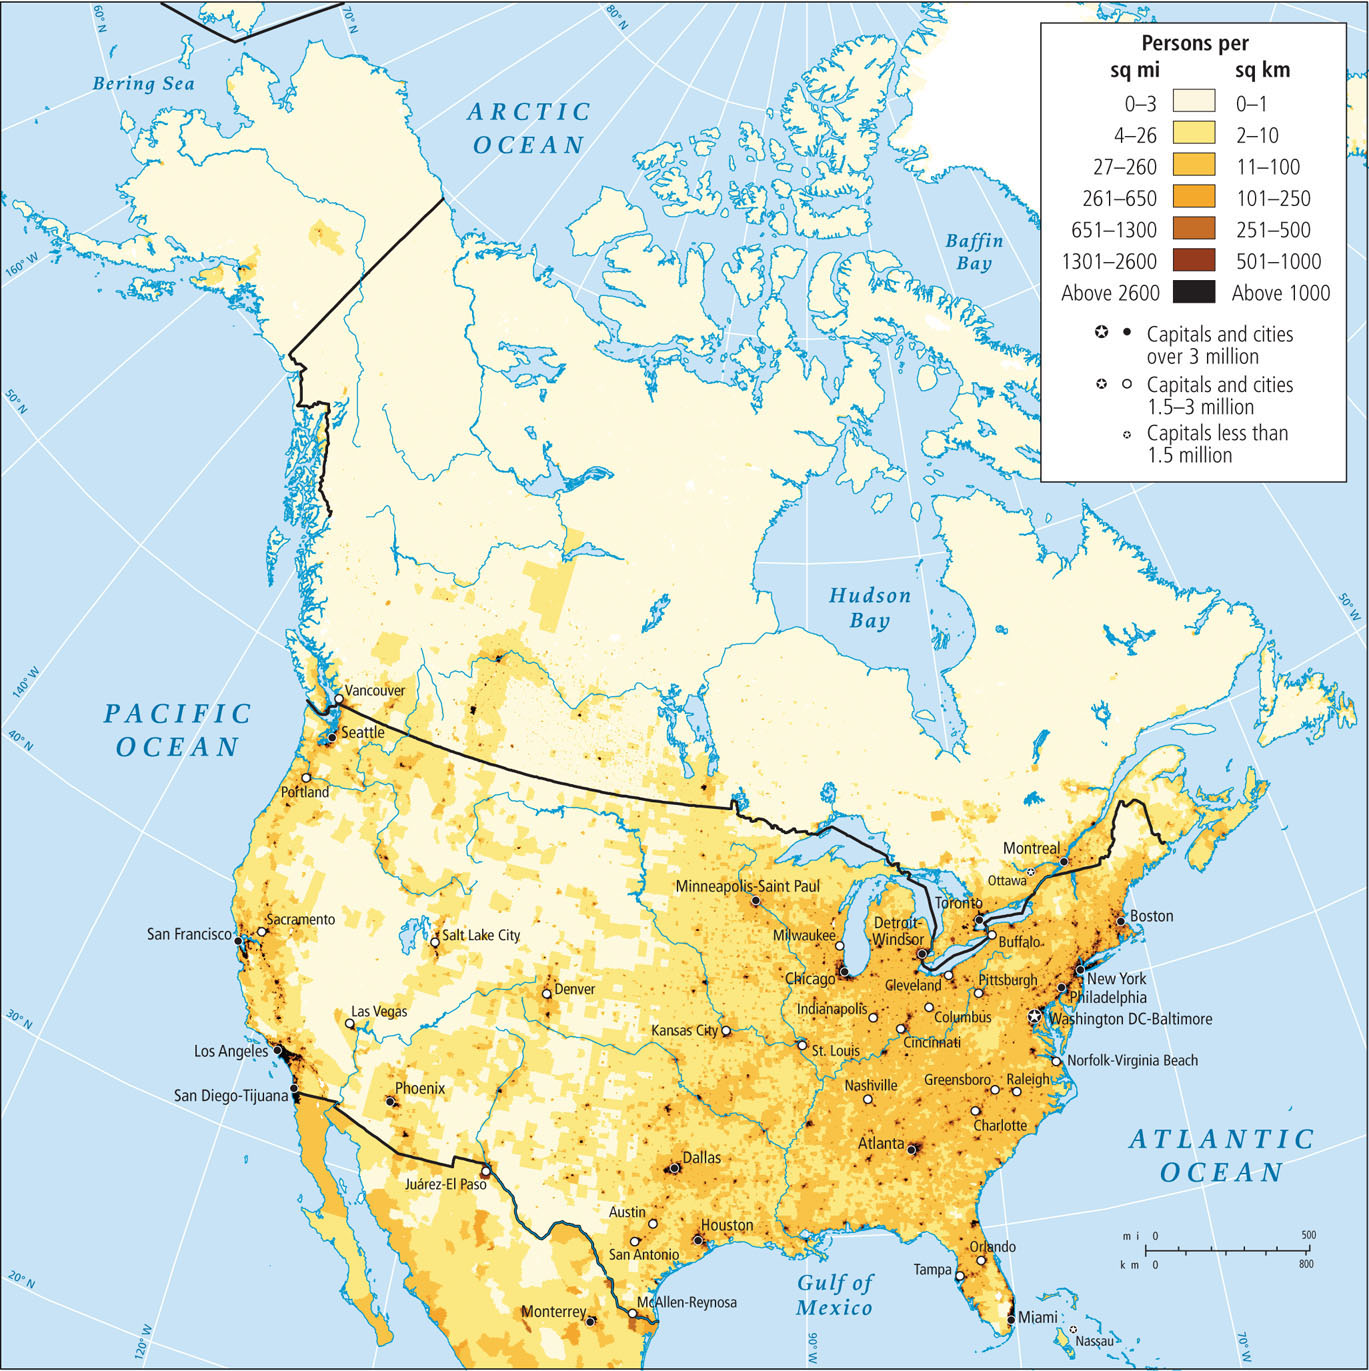
The population map of North America (Figure 2.34) shows the uneven distribution of the more than 346 million people who live on the continent. Canadians make up just under one-tenth (34.5 million) of North America’s population. They live primarily in southeastern Canada, close to the border with the United States. The population of the United States is 311.7 million, with the greatest concentration of people shifting away from the old economic core into other regions of the country that are now growing much faster. Just how this trend will play out, however, is uncertain. In 2004, the U.S. Census Bureau projected that between 2000 and 2030, the Northeast and Middle West would grow by less than 10 percent, while the South and West would grow by more than 40 percent. This general trend may persist, but the 2008 economic recession, water shortages, and the energy crisis have limited expansion, especially in the West but also in the South.
102
The Geography of Population Change in North America
In many farm towns and rural areas in the Middle West (the large central farming region of North America), populations are shrinking. As family farms are consolidated under corporate ownership, labor needs are decreasing and young people are choosing better-paying careers in cities. Middle Western cities are growing only modestly yet are becoming more ethnically diverse, with rising populations of Hispanics and Asians in places such as Indianapolis, St. Louis, and Chicago.  52. LATINO POLITICAL POWER
In the western mountainous interior, traditionally settlement has been light (see Figure 2.34). The principal reasons for this low density are rugged topography, lack of rain, and in northern or high altitude zones, a growing season that is too short to sustain agriculture. There are some population clusters in irrigated agricultural areas, such as in the Utah Valley, near rich mineral deposits or resort areas. The gambling economy and frenetic construction activity generated by real estate speculation account for several knots of dense population in the Southwest. Until the recession beginning in 2007, Las Vegas, Nevada, was the fastest-growing city in the United States (see Figure 2.21C). But by mid-2009, approximately 67,000 homes in Las Vegas were in foreclosure, tourist arrivals were sharply down, and hotel construction projects were abruptly halted with crane jibs left dangling in the air.
Along the Pacific Coast, a band of growing population centers stretches north from San Diego to Vancouver (see Figure 2.21A) and includes Los Angeles, San Francisco, Portland, and Seattle. These are all port cities engaged in trade around the Pacific Rim (all the countries that border the Pacific Ocean). Over the past several decades, these North American cities have become centers of technological innovation.
Pacific Rim a term that refers to all the countries that border the Pacific Ocean
The rate of natural increase in North America (0.5 percent per year) is low, less than half the rate of the rest of the Americas (1.2 percent). Still, North Americans are adding to their numbers fast enough through births and immigration that the population could reach more than 422 million by 2050. Many of the important social issues now being debated in North America are linked to changing population patterns—issues such as legal and illegal immigration; which language should be used in public schools and in government offices; the geography of voting patterns; urbanization; cultural diversity; mobility; and the social effects of an aging population.
Mobility in North America
Every year, almost one-fifth of the U.S. population and two-fifths of Canada’s population relocate. Some people are changing jobs and moving to cities; others are attending school, retiring to a warmer climate or a smaller city or town, or merely moving across town, to the suburbs, or to the countryside. Still other people are arriving from outside the region as immigrants.
Urbanization remains a powerful force behind this mobility. Dynamic economies and the search for lower production and living costs are drawing employers, employees, and retirees to urban areas. In Canada, people are going to cities in the southeast and on the West Coast. In the United States, people are moving to the South, Southwest, and Pacific Northwest. Cities in these areas, such as Vancouver and Toronto in Canada, and Atlanta, Georgia, and Washington, DC, in the United States, have sprouted satellite or “edge” cities around their peripheries, often based on businesses dealing with technology and international trade.
Aging in North America
During the twentieth century, the number of older North Americans grew rapidly. In 1900, one in 25 individuals was over the age of 65; by 2010, the number was 1 in 8. By 2050, when most of the current readers of this book will be over 65, it is likely that 1 in 5 North Americans will be elderly.
What Causes a Population to Age?
This aging of the region’s population relates both to longer life expectancy, which increases the number of older people, and to a declining birth rate, which decreases the number of younger people (Figure 2.35). While life expectancy increased steadily throughout the twentieth century, birth rates declined significantly after the 1960s when more women chose to obtain more education and pursue careers, resulting in their having fewer children.
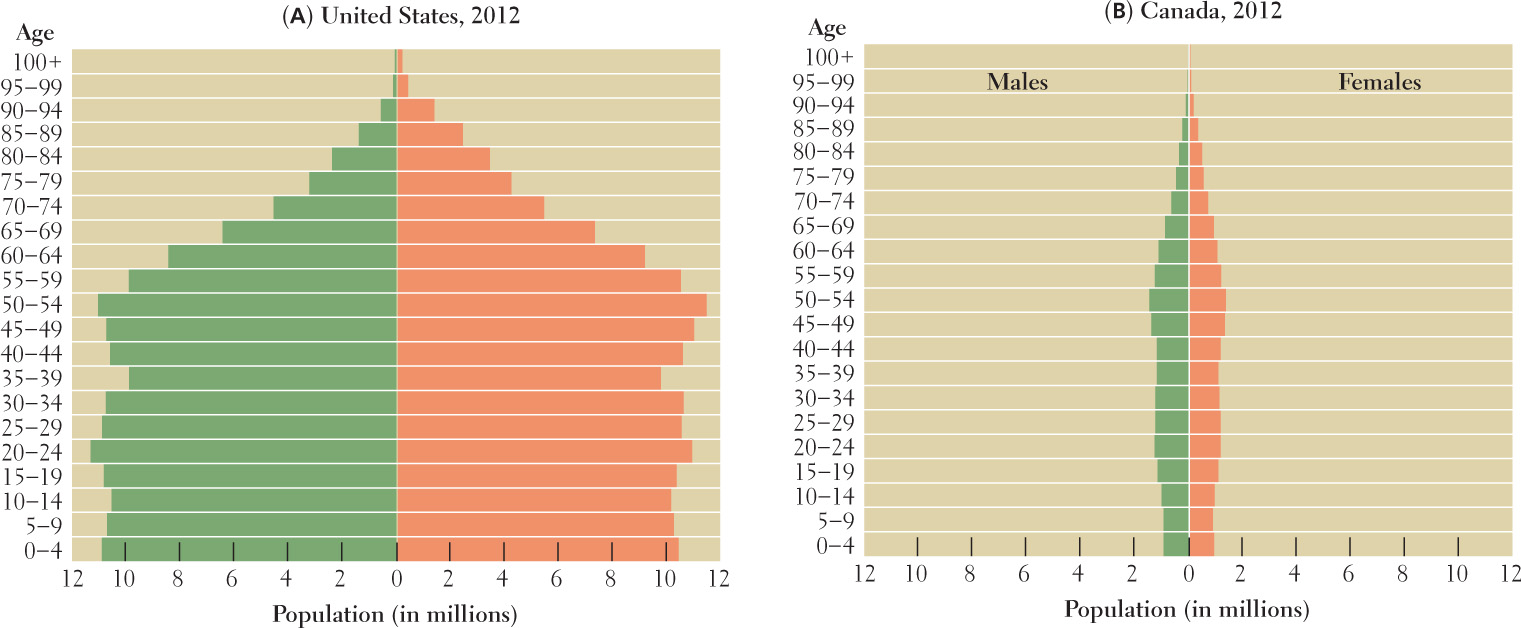
The number of North Americans over the age of 65 is already high by global standards and will increase dramatically over the next 20 years. This will result from the combination of the marked jump in birth rate that took place after World War II, from 1947 to 1964, and the ensuing drop in birthrate that occurred after 1965, as women chose to have fewer children. The so-called baby boomers (born between 1947 and 1965) constitute the largest age group in North America.
Dilemmas of Aging
Aging populations in developed countries like Canada and the United States present us with unfamiliar and as-yet unresolved dilemmas. On the one hand, it is widely agreed that globally, population growth should be reduced to lessen the environmental impact of human life on Earth, especially in those societies (such as in North America) that consume the most. On the other hand, slower population growth means that there will be fewer working-age people to keep the economy going and to provide the financial and physical help the increasing number of elderly people will require. For these reasons, immigrants and their offspring are important to the system. To reiterate: first, immigrants perform important production and consumption roles in our society. Second, their Social Security tax payments are helping to support the large group of retiring boomers; while they were working, the boomers’ contributions were paid into trust funds that supported then-current Social Security recipients. Finally, because of the increasing demand for caregivers for the aged, some immigrants will fill in for the diminished supply of boomer kinfolk as paid caregivers and companions.
103
Given that the population is aging, should retirement ages be extended from 65 to perhaps 75? Might this deprive young people of access to jobs? These worries have greatly preoccupied Europeans, for whom retirement ages can be as low as 58 and whose populations are aging faster than North Americans. Economists who have studied this issue say that it clearly makes sense to extend the retirement age. First, this means those over 65 will remain self-supporting longer; second, the talents and experience of these people will remain in circulation; third, statistics across the developed countries attest to the fact that high elderly employment rates are associated with high youth employment, not unemployment. Working people of any age spend their incomes and create jobs by so doing. A society that pays an increasing proportion of its workers to not work cannot prosper.
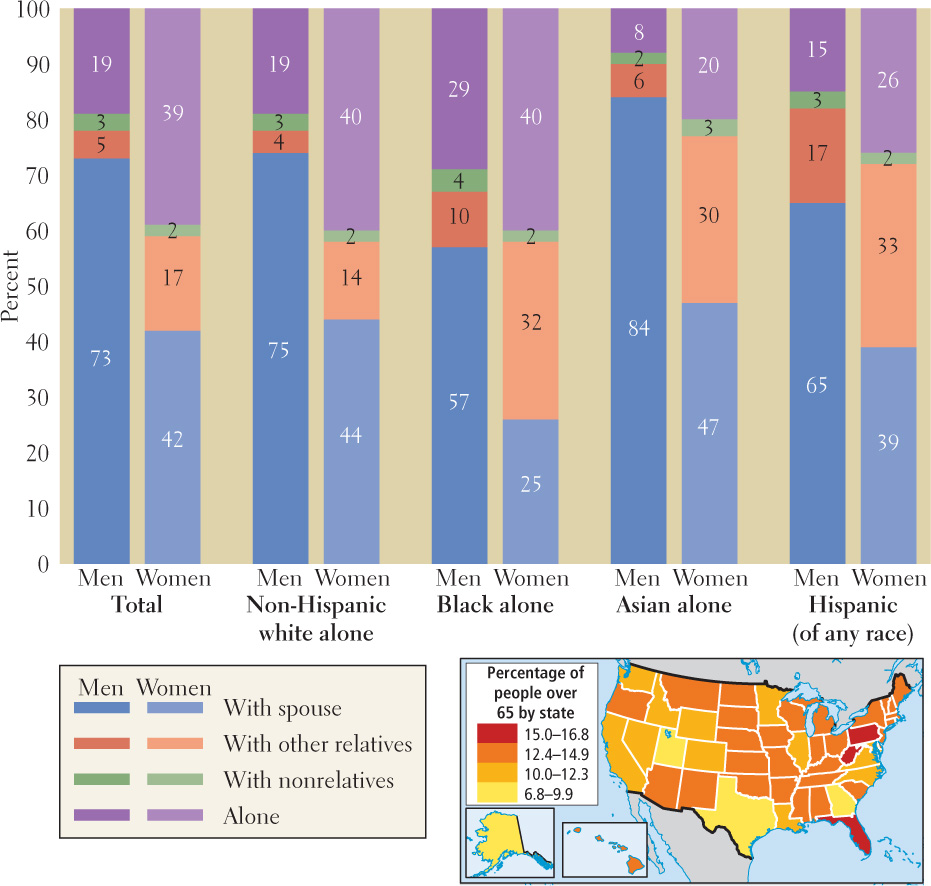
Eventually, most elderly people will need special attention of some sort. To avoid the social isolation that so many elderly are already encountering, it will be necessary to develop affordable alternative living arrangements. Figure 2.36 shows how the elderly of various ethnic groups in the United States are living now. Notice how elderly women in all groups are the ones most likely to live alone. Although Americans of all ages are choosing to live alone more than in the past, for the elderly this can be problematic as physical frailty increases and incomes shrink. Day care and cohousing for the elderly, where residents look after each other with the aide of a small staff, are two affordable strategies to provide care and companionship.
104
Geographic Patterns of Human Well-Being
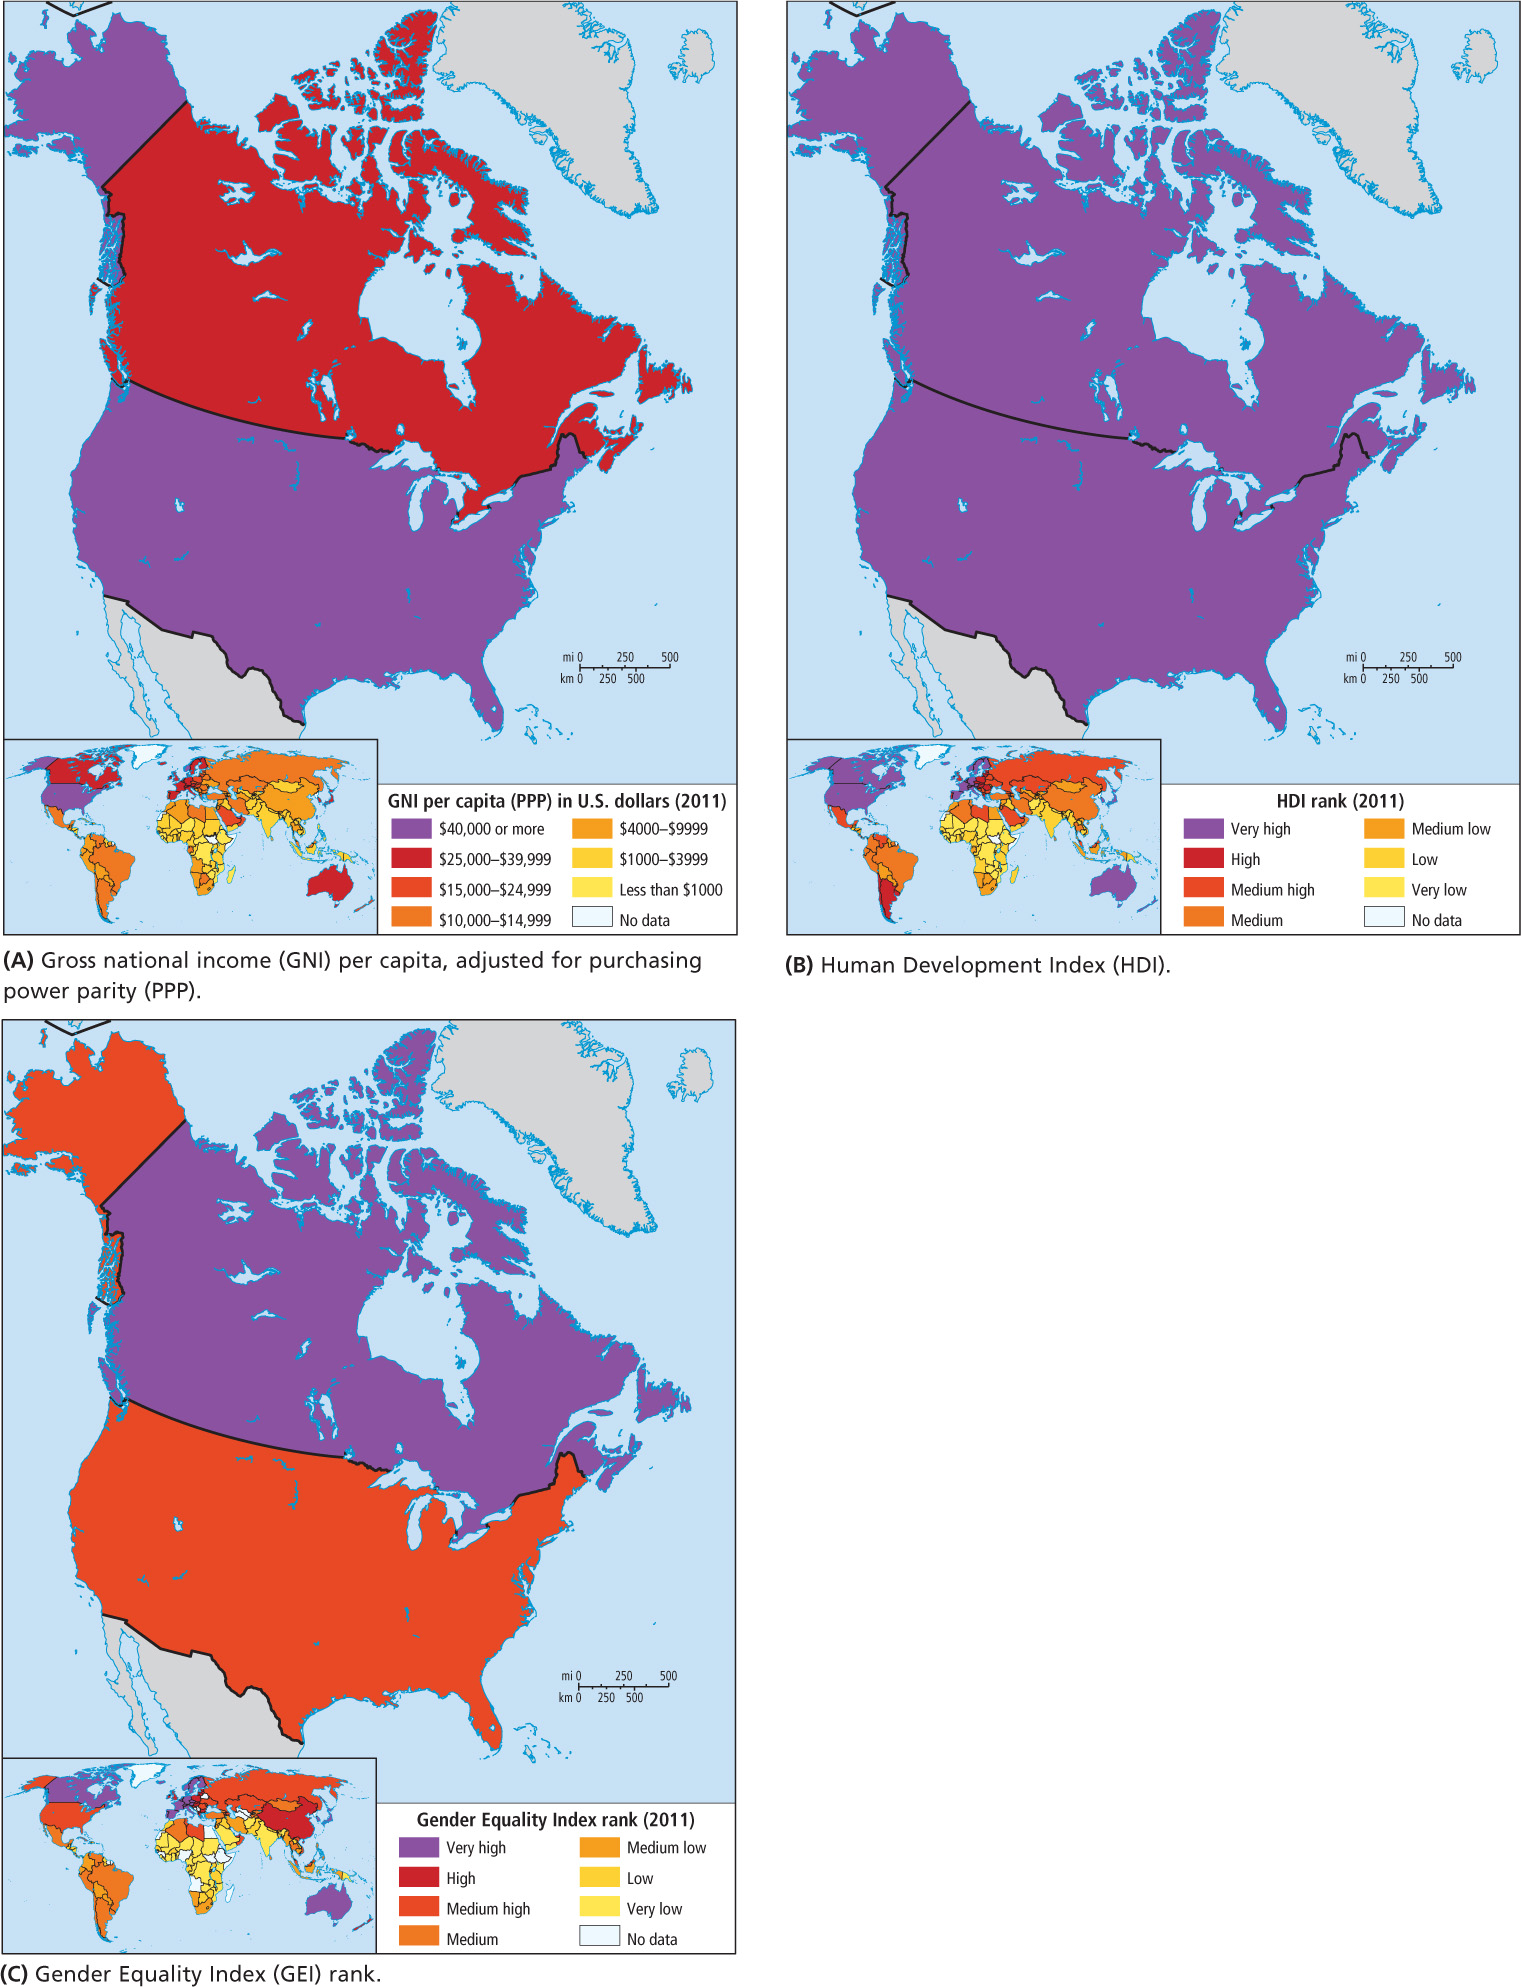
The maps of human well-being for North America tell a quick and somewhat misleading story (Figure 2.37). First of all, we learn from Map A that both countries in this region have very high average per capita GNI (PPP) figures and that in the global context (see the global inset for Map A), these two countries are among the most wealthy. But this is a classic example of why average GNI figures are not a sufficient measure of well-being, because we now know that there is much disparity of wealth in North America that is not revealed by country-level GNI figures. This map does not show how the wealth is distributed geographically or between social classes. It gives no hint that 22 percent of children in the United States and 14 percent in Canada are classed as poor despite having at least one working parent, that the situation has deteriorated over the last decade, or that in these countries the richest 10 percent have more than 14 times the wealth of the poorest 10 percent. The truth is that at the local scale the poor are geographically separated from the middle class so completely that poor children often experience life only in very deprived communities.
105
Virtually the same problem is presented by Map B, which shows the ranks of these two countries on the United Nations Human Development Index (HDI). Because the data are presented for the entire countries, not at the province or state level, the fact that many parts of both countries provide very well for their citizens in terms of income, health care, and education boosts the average figures for all. Glossed over is the reality that there are significant pockets of poverty, ill health, and illiteracy in virtually every state and province (they are less devastating in Canada because of its more robust safety net).
Map C is a composite measure reflecting the degree to which there is inequality in achievements between women and men in three dimensions: reproductive health, empowerment, and the labor market. A high rank indicates that the genders are tending toward equality. But notice that disparity in pay is not used, probably because statistics on pay by gender are not being submitted by many governments. Map C reveals that the United States lags behind Canada and other places on Earth, in gender equality. Of those with comparable per capita GNI figures, Australia and North and West Europe are doing better at equalizing pay and opportunity for female and male citizens. In fact, nowhere on Earth has actual gender equity been achieved.
THINGS TO REMEMBER
 The population of North America is changing in distribution and becoming more diverse.
- North Americans are highly mobile. Every year, for a variety of reasons, almost one-fifth of the U.S. population and two-fifths of the Canadian population move to a different location.
- North America’s population is rapidly aging, and by 2050, one in five people will be over the age of 65. There will be fewer young people to work, pay taxes, and take care of the elderly.
- Birth rates in North America declined significantly after the 1960s as women chose to obtain more education and pursue careers, resulting in their having fewer children.