Relationships Between Canada and the United States
Citizens of Canada and the United States share many characteristics and concerns. Indeed, in the minds of many people—especially those in the United States—the two countries are one. Yet that is hardly the case. Three key factors characterize the interaction between Canada and the United States: asymmetries, similarities, and interdependencies.
Asymmetries
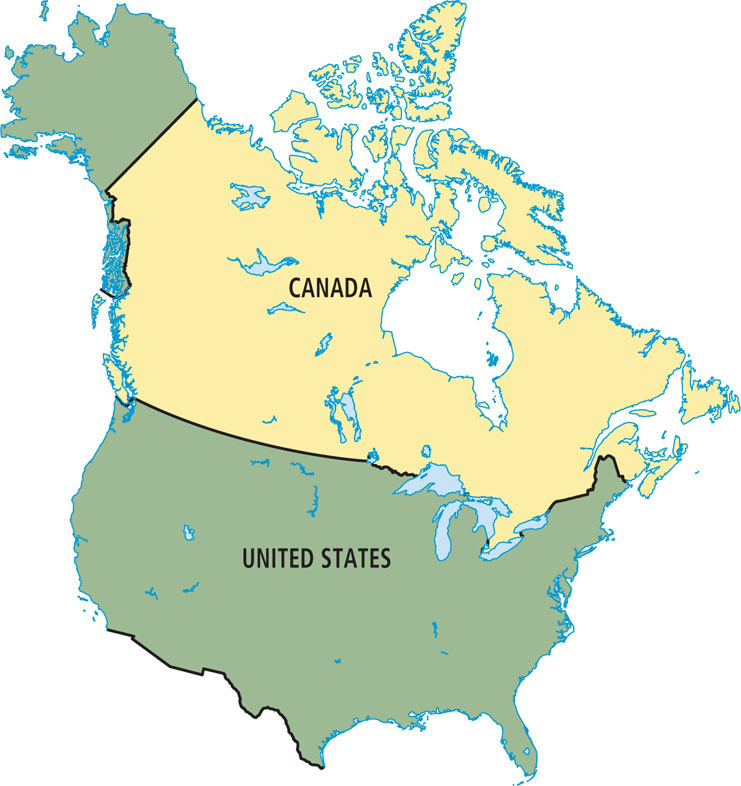
Asymmetry means “lack of balance.” Although the United States and Canada occupy about the same amount of space (Figure 2.14), much of Canada’s territory is cold and sparsely inhabited. The U.S. population is about ten times the Canadian population. While Canada’s economy is one of the largest and most productive in the world, producing U.S.$1.4 trillion (PPP) in goods and services in 2011, it is dwarfed by the U.S. economy, which is more than ten times larger, at $15.04 trillion (PPP) in 2011.
In international affairs, Canada quietly supports civil society efforts abroad. The United States is an economic, military, and political superpower preoccupied with maintaining a world leadership role. In framing foreign affairs policy, the United States references Canada’s position only as an afterthought, in part because the country is so secure an ally. But for Canada, managing its relationship with the United States is a top foreign policy priority. As former Canadian Prime Minister Pierre Trudeau once told the U.S. Congress, “Living next to you is in some ways like sleeping with an elephant: No matter how friendly and even-tempered the beast, one is affected by every twitch and grunt.” In 2008, for example, the robust, debt-free Canadian economy slowed abruptly, due in large part to the slump in U.S. consumer spending, which hurt Canadian exports such as oil, gas, and cars.
79
Similarities
Notwithstanding the asymmetries, the United States and Canada have much in common. Both are former British colonies and have retained English as the dominant language. Both also experienced settlement and exploration by the French. From their common British colonial experience, they developed comparable democratic political traditions. Both are federations (of states or provinces), and both are representative democracies, with similar legal systems.
Not the least of the features they share is a 4200-mile (6720-kilometer) border, which until 2009 contained the longest sections of unfortified border in the world. For years, the Canadian border had just 1000 U.S. border guards, while the Mexican border, which is half as long, had nearly 10,000 agents. In 2009, the Obama administration decided to equalize surveillance of the two borders for national security reasons. Where some rural residents used to pass unobserved in and out of Canada and the United States many times in the course of a routine day, now there are drone aircraft with night-vision cameras and cloud-piercing radar scanning the landscape for smugglers, illegal immigrants, and terrorists. Canadians and Americans, who formerly thought of their common border as nonexistent, now endure intrusive technology, barricades, and crossing delays. Tourism and commerce are also negatively affected by these efforts to keep both countries safer.  42. U.S. BORDER SECURITY REPORT
Well beyond the border, Canada and the United States share many other landscape similarities. Their cities and suburbs look much the same. The billboards that line their highways and freeways advertise the same brand names. Shopping malls and satellite business districts have followed suburbia into the countryside, encouraging similar patterns of mass consumption and urban sprawl. The two countries also share similar patterns of ethnic diversity that developed in nearly identical stages of immigration from abroad.
Interdependencies
Canada and the United States are perhaps most intimately connected by their long-standing economic relationship. The two countries engage in mutual tourism, direct investment, migration, and most of all, trade. The equivalent of nearly U.S.$1.5 billion is traded daily between the two countries. Canada is a larger market for U.S. goods than are all 27 countries in the European Union. By 2005, that trade relationship had evolved into a two-way flow of U.S.$1 trillion annually (Figure 2.15). Each country is the other’s largest trading partner. In 2010, seventy-five percent of Canada’s imports came from the United States and 75 percent of its exports went to the United States. The United States, in turn, sells 18.97 percent of its exports to Canada and buys 14.34 percent of its imports from Canada.
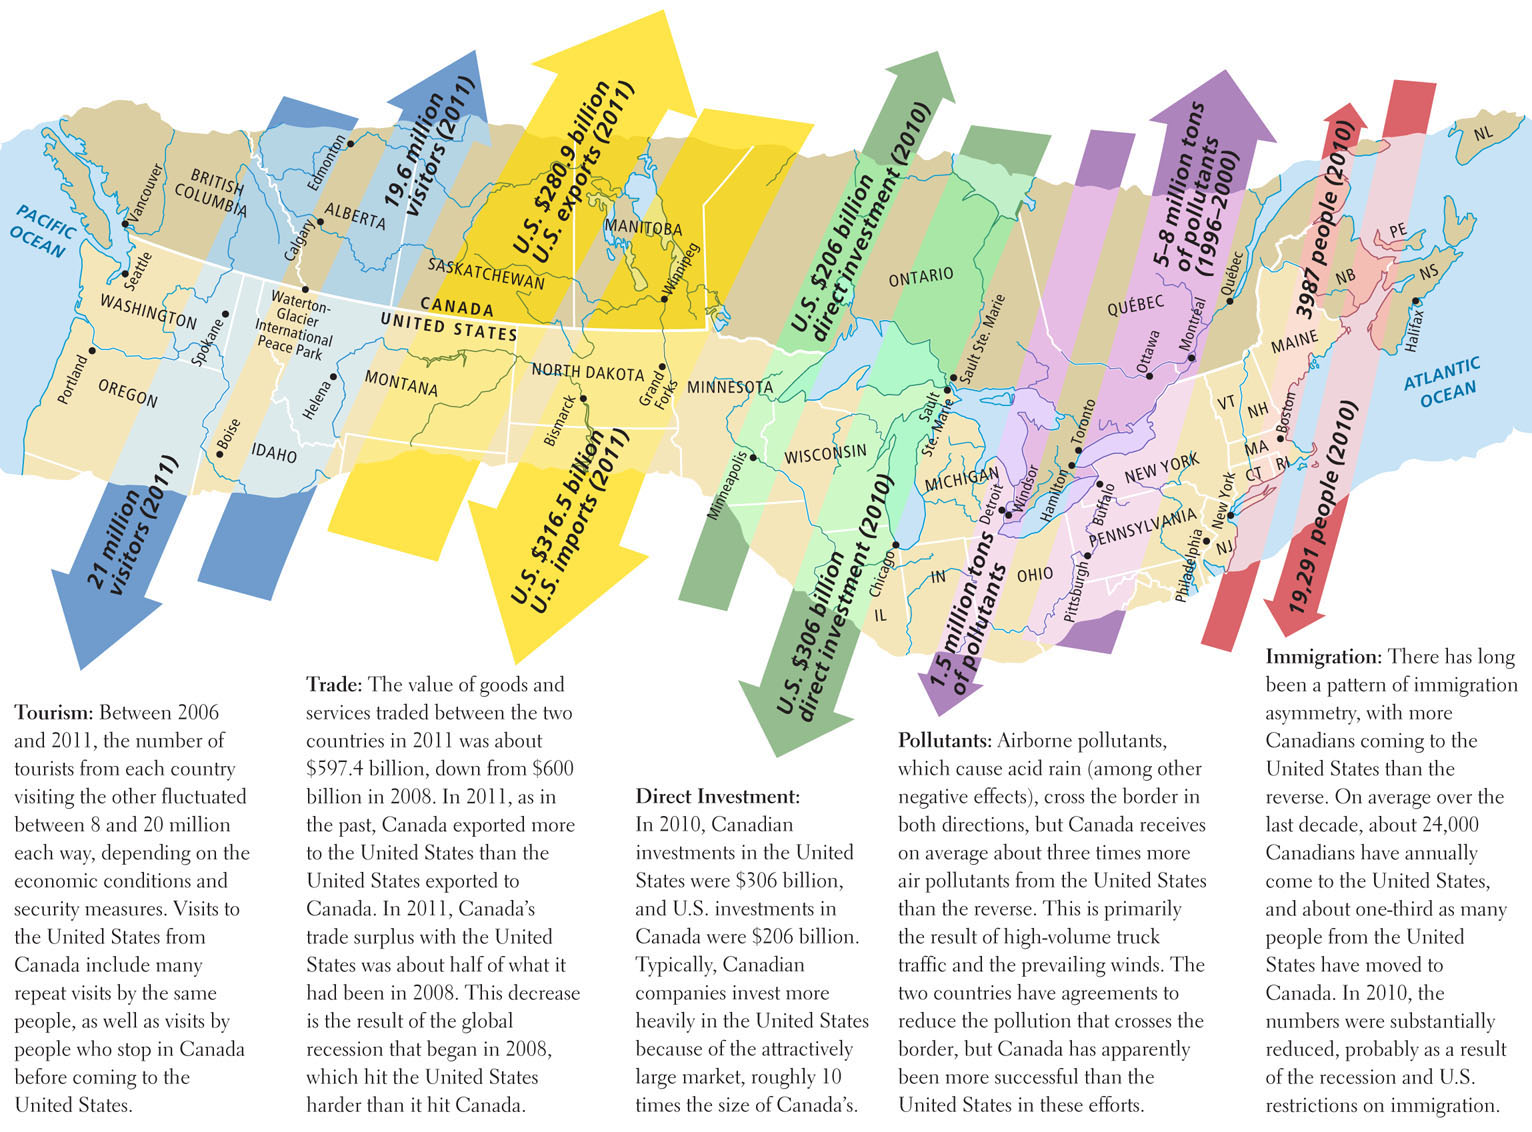
Notice, however, that there is asymmetry even in the realm of interdependencies: Canada’s smaller economy is much more dependent on the United States than the reverse. Nonetheless, as many as 1 million U.S. jobs are dependent on the relationship with Canada.
Democratic Systems of Government: Shared Ideals, Different Trajectories
Canada and the United States have similar democratic systems of government, but there are differences in the way power is divided between the federal government and provincial or state governments. There are also differences in the way the division of power has changed since each country achieved independence.
Both countries have a federal government, in which a union of states (provinces, in Canada) recognizes the sovereignty of a central authority, while many governing powers are retained by state/provincial or local governments. In both Canada and the United States, the federal government has an elected executive branch, elected legislatures, and an appointed judiciary. In Canada, the executive branch is more closely bound to follow the will of the legislature. At the same time, the Canadian federal government has more and stronger powers (at least constitutionally) than does the U.S. federal government.
Over the years, both the Canadian and U.S. federal governments have moved away from the original intentions of their constitutions. Canada’s originally strong federal government has become somewhat weaker. This change is largely in response to demands by provinces, such as the French-speaking province of Québec (see the map in Figure 2.1), for greater autonomy over local affairs.
Meanwhile, the initially more limited federal government in the United States has expanded its powers. The U.S. federal government’s original source of power was its mandate to regulate trade between states. Over time, this mandate has been interpreted ever more broadly. Now the U.S. federal government powerfully affects life even at the local level, primarily through its ability to dispense federal tax monies via such means as grants for school systems, federally assisted housing, military bases, drug and food regulation and enforcement, urban renewal, and the rebuilding of interstate highways. Money for these programs is withheld if state and local governments do not conform to federal standards. This practice has made some poorer states dependent on the federal government. However, it has also encouraged some state and local governments to enact more enlightened laws than they might have done otherwise. For example, in the 1960s the federal government promoted civil rights for African American citizens by requiring states to end racial segregation in schools in order to receive federal support for their school systems.
80
The Social Safety Net: Canadian and U.S. Approaches
The Canadian and U.S. governments have responded differently to the displacement of workers by economic change. Ultimately, these differences derive from prevailing political positions and widely held notions each country has about what the government’s role in society should be. In Canada there is broad political support for a robust social safety net, the services provided by the government—such as welfare, unemployment benefits, and health care—that prevent people from falling into extreme poverty. In the United States there is much less support for these programs and a great deal of contention over nearly all efforts to strengthen the U.S. social safety net.
social safety net the services provided by the government—such as welfare, unemployment benefits, and health care—that prevent people from falling into extreme poverty
81
For many decades, Canada has spent more per capita than the United States on social programs. These programs, especially unemployment benefits, have generally made the financial lives of working Canadians more secure. These policies also reflect the workings of Canada’s democracy; voters have supported tax hikes to fund several major expansions of the social safety net during the twentieth century.
Compared to Canada, the United States provides much less of a social safety net. For years the prevailing political argument against expansion of the U.S. social safety net has been that the system offers lower taxes for businesses, corporations, and the wealthy, which in turn invest their surpluses in expansions or in new businesses, thus creating jobs and new taxpayers. These benefits of low taxes are assumed to trickle down to those most in need. The fit of this position with the reality of what actually happens has long been challenged, especially during times of economic recession.
Two Health-Care Systems
The contrasts between health-care systems in the two countries are indeed striking. The Canadian system, reformed in the 1970s, is heavily subsidized and covers 100 percent of the population. In the United States, health care has been largely private, relatively expensive, and tied to employment, which made changing jobs difficult for those with preexisting conditions. Also, many small businesses did not provide health insurance coverage for employees, who had to pay for it themselves or go without. A recent reform, dubbed “Obamacare” after President Obama, who pushed for the change, will cover most of the 47 million people who previously had no coverage; and government subsidies for care for the elderly, the disabled, children, veterans, and the poor will continue.
The financial viability and medical outcomes of Obamacare are not yet known because the plan will not be fully implemented until 2014, but the most recent statistics show why change was needed. In 2011, the United States spent more per capita on health care than any other industrialized country—$8680 per capita, for a total of 17.9 percent of GDP. Canada spent $5948 per capita, or just 11.6 percent of its GDP (GNI figures are not available)—yet Canada had better health outcomes, outranking the United States on most indicators of overall health, such as infant mortality, maternal mortality, and deaths per 1000 (Table 2.1). 48. SICKO REPORT
| Country | Health care cost as a percentage of GDP | Percentage of population with no insurance | Deaths per 1000† | Infant mortality per 1000 live births in 2009* | Maternal mortality per 100,000 live births in 2008‡ | Life expectancy at birth (years) in 2011* | Annual health expenditures per capita (PPP U.S.$) in 2009 |
|---|---|---|---|---|---|---|---|
| Canada | 10.9 | 0 | 7 | 6 | 7 | 78.5 | $5948§ |
| United States | 16.2 | 15.5 | 8 | 8 | 17 | 81 | $8680** |
| Sources: *United Nations Development Program, Human Development Report 2011 (New York: United Nations Development Programme), Tables 1, 9, and 10, at http://hdr.undp.org/en/reports/global/hdr2011. Retrieved January 2012. | |||||||
| †Population Reference Bureau, 2011 World Population Data Sheet, at http://www.prb.org/Publications/Datasheets/2011/world-population-data-sheet/data-sheet.aspx. Retrieved January 2012. | |||||||
| ‡Medical News Today, “Maternal Mortality Rises in the USA, Canada and Denmark, and Falls in China, Egypt, Ecuador and Bolivia,” April 13, 2010, at http://www.medicalnewstoday.com/articles/185154.php. | |||||||
| §News Medical, “Health Care Spending in Canada Expected to Reach $183.1 Billion in 2009: CIHI,” November 19, 2009, at http://www.news-medical.net/news/20091119/Health-care-spending-in-Canada-expected-to-reach-241831-billion-in-2009-CIHI.aspx. | |||||||
| **Centers for Medicare & Medicaid Services, “National Health Expenditures,” at https://www.cms.gov/NationalHealthExpendData/25_NHE_Fact_Sheet.asp#TopOfPage. Retrieved July 2012. | |||||||
Gender in National Politics
North America has some powerful political contradictions with regard to gender. While women voters are an ever more potent political force, successful female politicians are not as numerous as one might expect. Women cast the deciding votes in the U.S. presidential election of 1996, voting overwhelmingly for Bill Clinton. In the 2006 interim elections, 55 percent of women voted for the Democratic Party candidates, registering strong anti-war sentiment and making it possible for the Democratic Party to gain many seats in Congress. In 2008 and 2012, Barack Obama won 55 percent of the female vote. Deciding factors in the election included issues that are often priorities for women, such as reproductive rights, health care, family leave, equal pay, day care, and ending the wars in Iraq and Afghanistan. 49. WOMEN VOTING REPORT
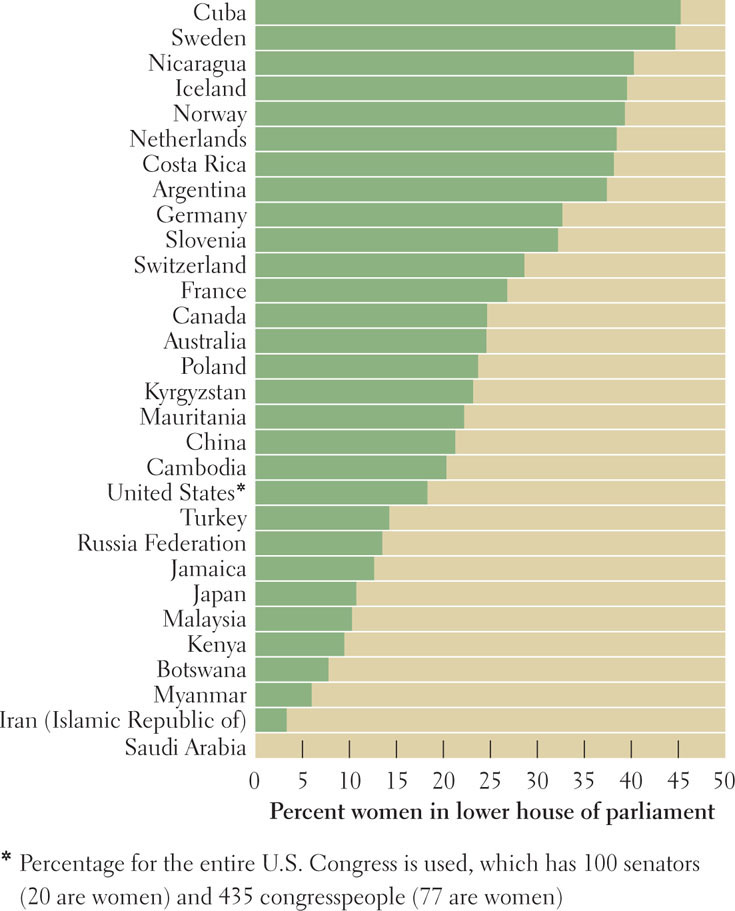
And yet, as elected political leaders, women have not had the success warranted by their powerful role as voters. Of the 535 people in the U.S. Congress as of 2013, only 98 members, or 18.3 percent, were women. Gender equity was a bit closer at the state level, where 24.1 percent of legislators were women as of the 2012 elections. In Canada, women have had somewhat more success. As of 2012, Canadian women constituted 25 percent of the House of Commons in Parliament and held 24 percent of provincial legislative seats. Neither country does well by comparison to the world at large in that, as Figure 2.16 (see page 82) shows, by 2012 many countries have added substantial female representation to legislatures.
Things are somewhat more equitable for Canadian women at the executive level. In 2011, Canada elected four women as provincial governors and another as executive of Nunavut. (There are ten provinces and three territories.) After the 2012 election, the United States had 7 out of a possible 50 female governors. Canada briefly had a female prime minister in 1993. While the United States has never had a female president, in 2008 Hillary Clinton was the first woman to have a serious chance at becoming the U.S. president when she competed with Barack Obama to become the Democratic Party candidate.
82
THINGS TO REMEMBER
 _div_Geographic Insight 3_enddiv_Power and Politics Canada and the United States are vocally proud of their democratic traditions. While promoting democracy abroad is an oft-stated ideal of U.S. official foreign policy (it is less of one for Canada), in actuality the global distribution of U.S. spending on foreign aid and military assistance indicates that U.S. strategic and economic interests take precedence over promoting democracy.
- Canada continues to have a more robust social safety net, including health care, than does the United States.
- While women voters are an ever more potent political force in the United States and Canada, the number of successful female politicians has not been commensurate with the percentage of women in the general population of each country.