Geographic Patterns of Human Well-Being
As we have observed in previous chapters, gross national income (GNI) per capita can be used as a general measure of well-being because it shows broadly how much money people in a country have to spend on necessities. However, it is only an average figure and does not indicate how income is actually distributed across the population. Thus, it does not show whether income is equally apportioned or whether a few people are rich and most are poor. (As discussed in earlier chapters, the term GNI is often followed by PPP, which indicates that all figures have been adjusted for cost of living and so are comparable.)
The map in Figure 7.32A indicates three things regarding GNI in this region. First, most countries are yellow or light yellow in color, indicating that they are in the two lowest GNI ranks (incomes are under $4000). None are in the top two categories of GNI per capita rank (dark red or purple colors), and only two very small countries, Equatorial Guinea and the Seychelles, are in the medium-high rank (lighter red). A look at the world map inset for GNI shows that of all regions on Earth, sub-Saharan Africa has the lowest figures. A band of countries with somewhat higher GNIs runs along the west side of the continent from Equatorial Guinea through South Africa. In these countries, GNI per capita ranges from U.S.$4000 to U.S.$24,999, but only little Gabon, Botswana, and the tiny island countries of Mauritius and Seychelles, far to the east in the Indian Ocean, are in the medium category, averaging U.S.$10,000 to U.S.$14,999 per year. Gabon and Botswana depend on extractive industries—selling timber, oil, manganese, and diamonds—and in both, the income disparity is rather stark. South Africa, which is actually considered Africa’s most developed country because of its industry, has a GNI that averages less than U.S.$9999. There is no data for South Sudan and Somalia; but as discussed elsewhere, both are dangerously troubled countries.
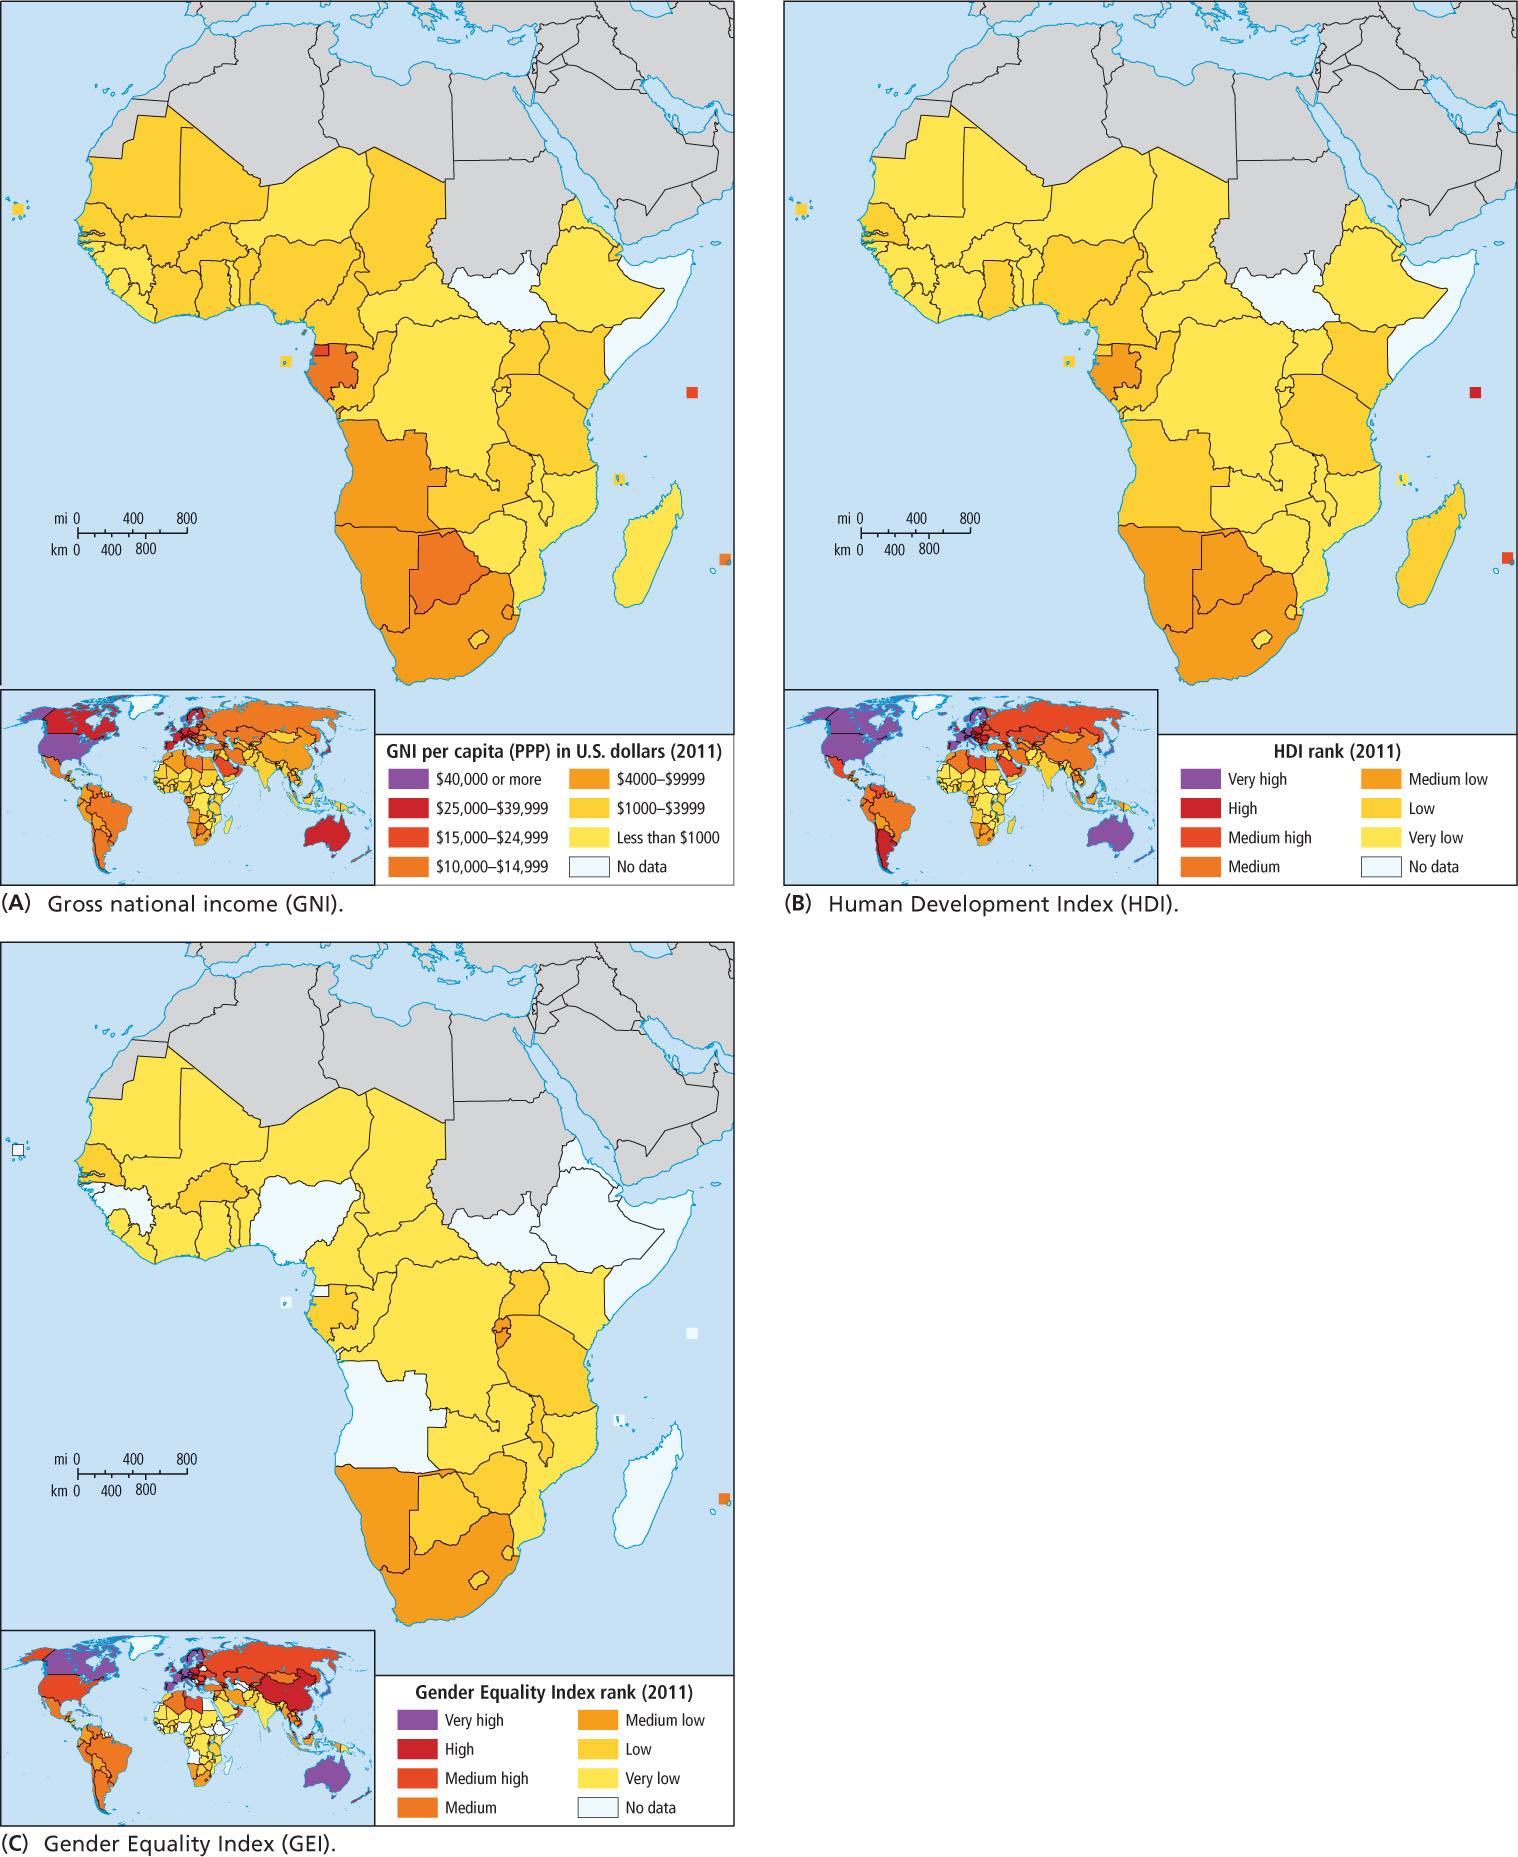
Figure 7.32B depicts countries’ rank on the Human Development Index (HDI), which is a calculation (based on adjusted real income, life expectancy, and educational attainment) of how adequately a country provides for the well-being of its citizens. In this region, HDI ranks stretch from high (Seychelles) and medium-high (Mauritius) to very low, with only Botswana, Gabon, South Africa, and Namibia ranking medium-low. As noted in Chapter 6, if on the HDI scale a country drops below its approximate position on the GNI scale, one might suspect that the lower HDI ranking is due to the poor distribution of wealth and social services: A critical mass of people are simply not getting a sufficient share of the national income to have good health care and an education. A host of countries along the west coast from Burkina Faso to South Africa rank lower on HDI than they do on GNI. Only the Seychelles and Mauritius have higher ranks on HDI (high and medium-high, respectively) than on GNI.
Figure 7.32C shows how well countries are ensuring gender equality in three categories: reproductive health, political and educational empowerment, and access to the labor market. First, as is true across the globe, nowhere in this region are women paid equally to men; but notice on the world inset map that gender disparity is less extreme in sub-Saharan Africa than in North Africa and Southwest Asia. Certainly, it is important to remember that GNI per capita figures (a surrogate for average income) are generally very low for this region, but the greater equality of income does mean that women are economically active; other evidence on gender (discussed previously) indicates that women in Africa are improving their social and economic status and are beginning to take leadership roles.