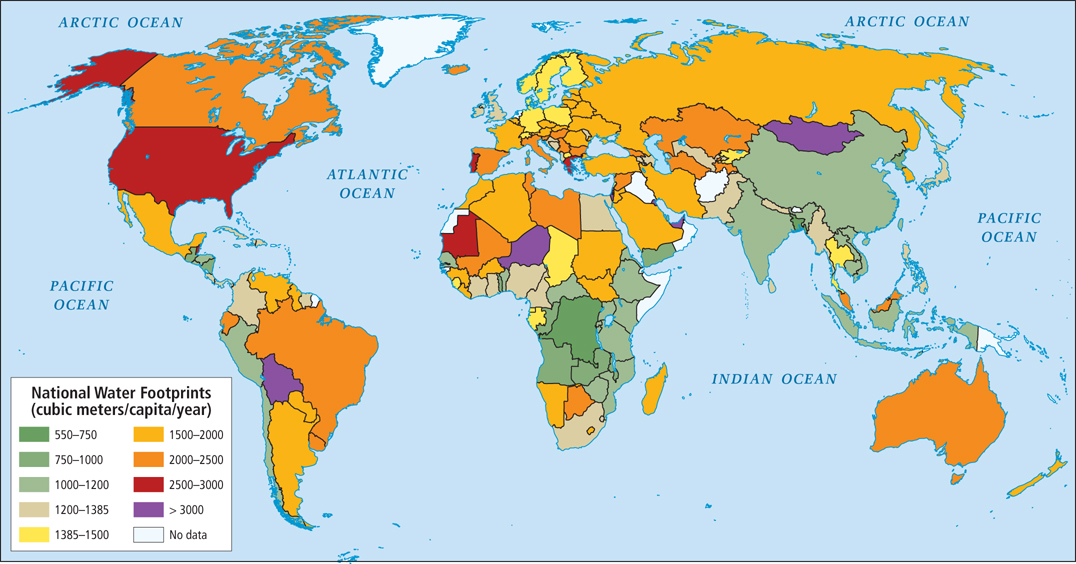
Figure 1.16: Map of national water footprints, 2005. Average national water footprint per capita (in cubic meters per capita per year). The color green indicates that the nation’s water footprint is equal to or smaller than the global average. Countries in red and purple have a water footprint beyond the global average. (The latest year for which data are available is 2005.)
[Sources consulted: United Nations World Water Development Report 2: Water— A Shared Responsibility . Published jointly in 2006 by the UN Educational, Scientific and Cultural Organization (UNESCO), Paris; and Berghahn Books, New York, pp. 391– 392]