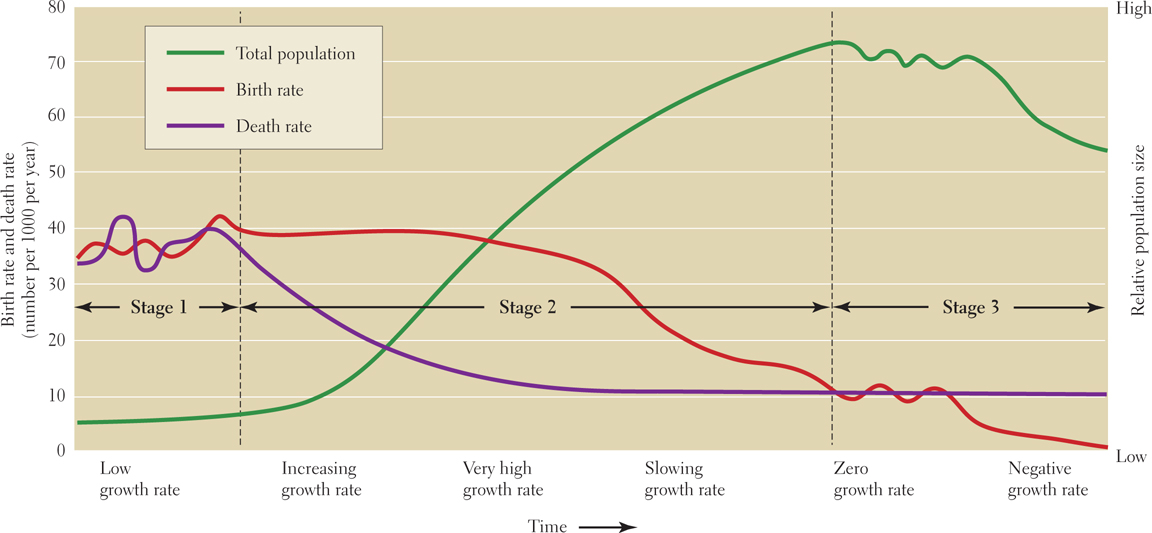
Figure 1.28: Demographic transition diagram. In traditional societies (Stage 1), both birth rates and death rates are usually high (left vertical axis), and population numbers (right vertical axis) remain low and stable. With advances in food production, education, and health care (Stage 2), death rates usually drop rapidly, but strong cultural values regarding reproduction remain, often for generations, so birth rates drop much more slowly, with the result that for decades or longer, the population continues to grow significantly. When changed social and economic circumstances enable most children to survive to adulthood and it is no longer necessary to produce a cadre of family labor (Stage 3), population growth rates slow and may eventually drift into negative growth. At this point, demographers say that the society has gone through the demographic transition.
[Source consulted: G. Tyler Miller, Jr., Living in the Environment, 8th ed. (Belmont, CA.: Wadsworth, 1994), p. 218]