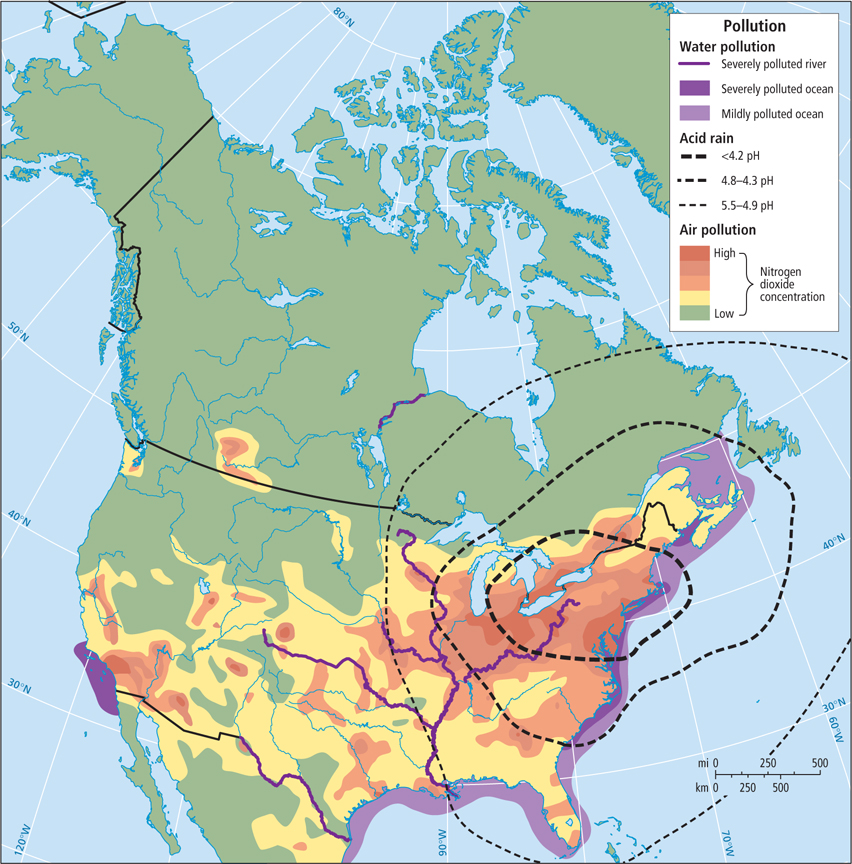
Figure 2.6: Air and water pollution in North America. This map shows two aspects of air pollution, as well as polluted rivers and coastal areas. Red and yellow indicate concentrations of nitrogen dioxide (NO2), a toxic gas that comes primarily from the combustion of fossil fuels by motor vehicles and power plants. This gas interacts with rain to produce nitric acid, a major component of acid rain, as well as toxic organic nitrates that contribute to urban smog. The map also shows polluted coastlines (including all of the coastline from Texas to New Brunswick) as well as severely polluted rivers, which include much of the Mississippi River and its tributaries.