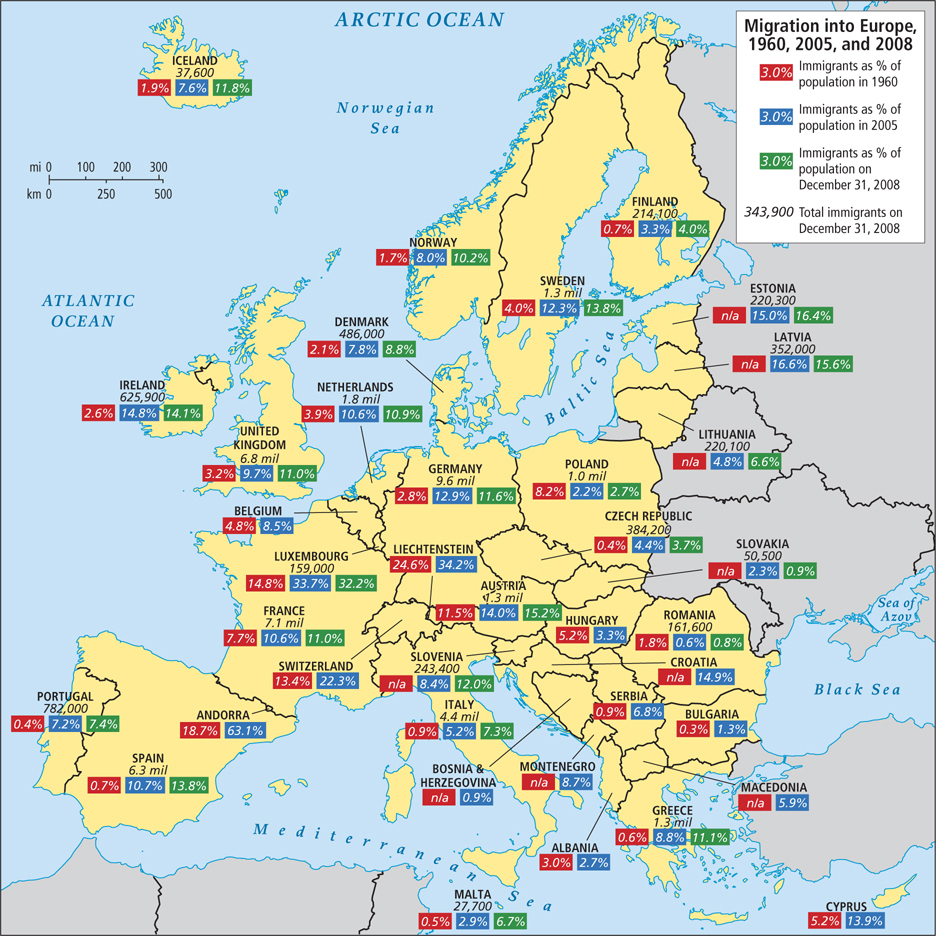
Figure 4.23: Migration into Europe, 1960, 2005, and 2008. Migration into Europe increased from 1960 through the 1990s and continued to increase into the twenty-first century for most countries. Migration continues to be a crucial issue in EU debates. The percentages of total population are shown in the three colored boxes for each country: the red box for 1960, the blue box for 2005, and the green box for 2008. The number of immigrants living in each country at the end of 2008 is above the two boxes.
[Sources consulted: Human Development Report 2009, United Nations Development Programme, at http://hdr.undp.org/en/content/human-development-report-2009; data in table is from Migrants in Europe: A Statistical Portrait of the First and Second Generation, Eurostat Statistical Books, 2011, Table 1, at http://epp.eurostat.ec.europa.eu/cache/ITY_OFFPUB/KS-31-10-539/EN/KS-31-10-539-EN.PDF]