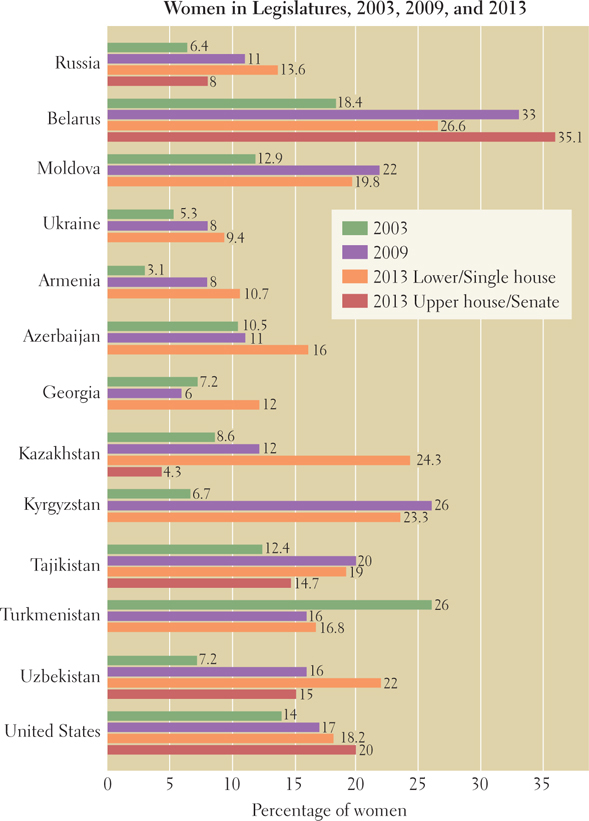
Figure 5.25: Women legislators, 2003, 2009, and 2013. This graph shows the percentage of legislators in Russia and the post- Soviet states (with the United States for comparison) who are women. Notice that over the last decade in some countries, the number of women in parliament has expanded and then contracted. Also note that the countries with the largest percentage of female legislators are not necessarily those with the most open democratic participation.
[Source consulted: Human Development Report 2011 Statistical Annex, Table 4, United Nations Development Programme, at http://www.undp.org/content/dam/undp/library/corporate/HDR/2011%20Global%20HDR/English/HDR_2011_EN_Tables.pdf]