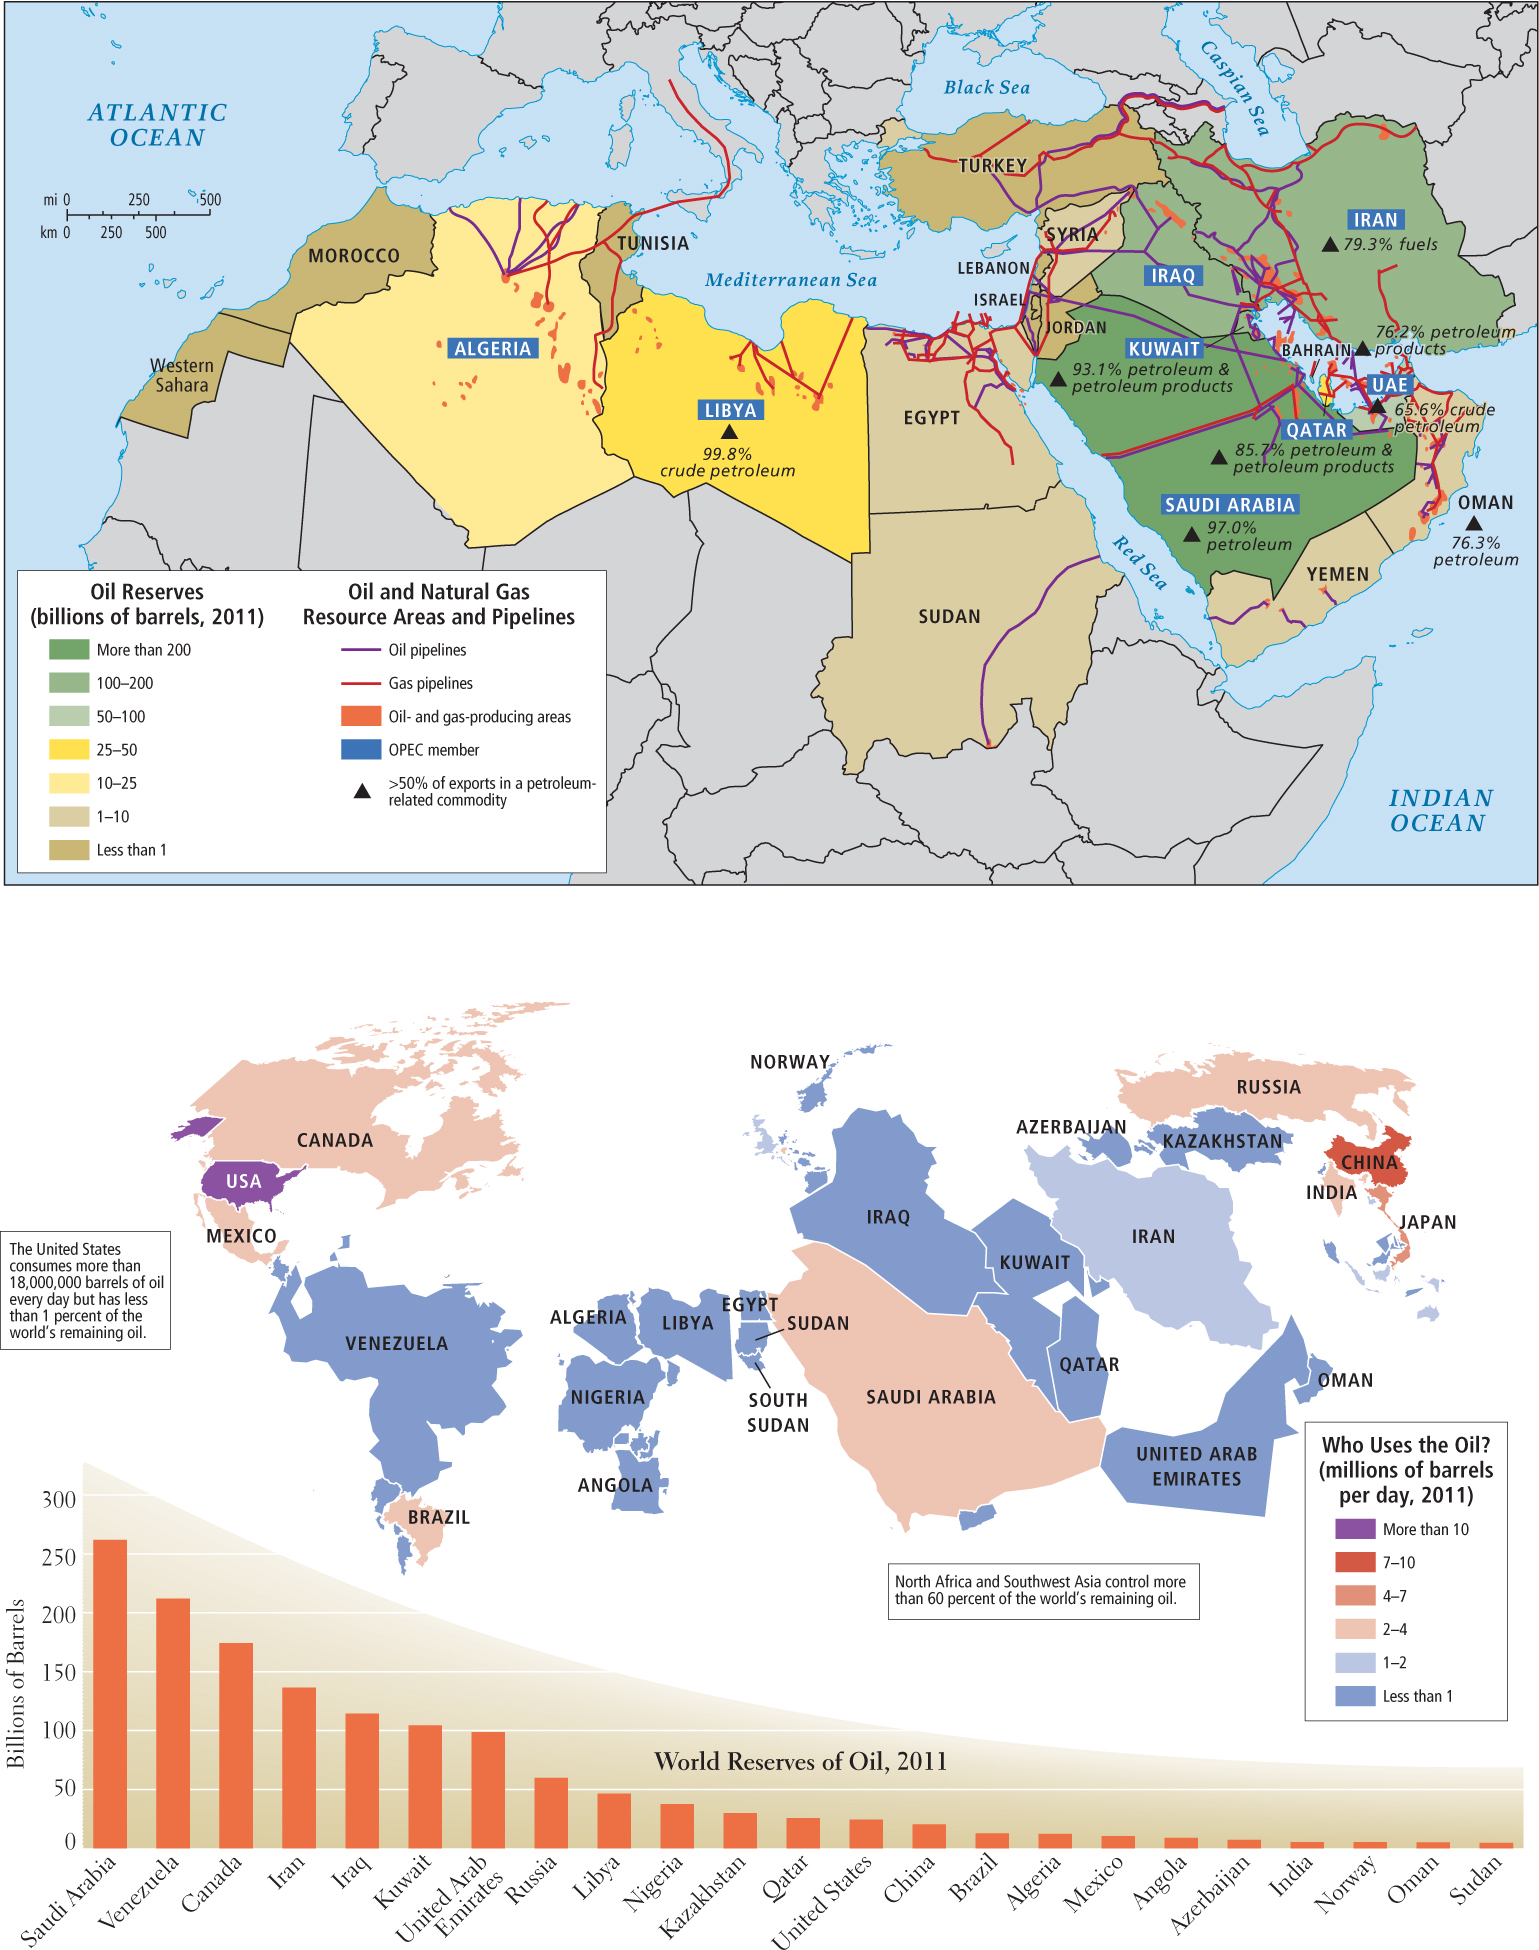
Figure 6.18: Economic issues: Oil and gas resources in North Africa and Southwest Asia. (A) The map shows the oil reserves, oil and gas resource areas, and pipelines in the region. (B) The graph shows the oil reserves by country; in the map, the size of countries corresponds to the amount of oil reserves held, and the color corresponds to the amount used.
[Sources consulted (A): U.S. Department of Energy, Country Analysis Briefs, at http://www.eia.doe.gov/emeu/cabs/Region_me/html; U.S. Department of Energy, “Selected Oil and Gas Pipeline Infrastructure in the Middle East,” at http://www.eia.gov/countries/analysisbriefs/Saudi_Arabia/images/oil_gas_infrastructure_map.png]
[Sources consulted (B): “Who Has the Oil? A Map of the World Oil Reserves,” at http://gcaptain.com/who- has- the- oil- a- map- of- world- oil- reserves ; “Countries: Proved Reserves,” U.S. Department of Energy, Energy Information Administration, at http://www.eia.gov/countries/index.cfm?view=reserves.]