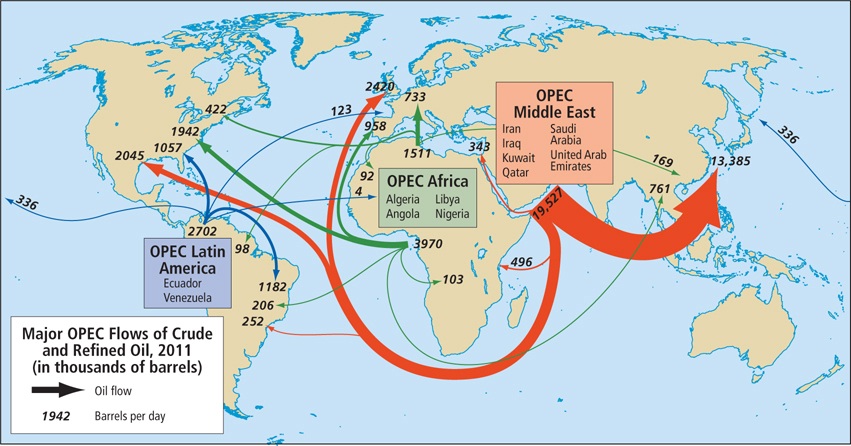
Figure 6.19: Major OPEC oil flows in 2011. The map shows the average number of barrels (in thousands) of crude oil and petroleum products distributed per day by OPEC to regions of the world.
[Sources consulted: Organization of the Petroleum Exporting Countries, Annual Statistical Bulletin, 2008, 2009; Annual Statistical Bulletin, 2012 (Vienna: OPEC, 2012), pp. 47– 3–