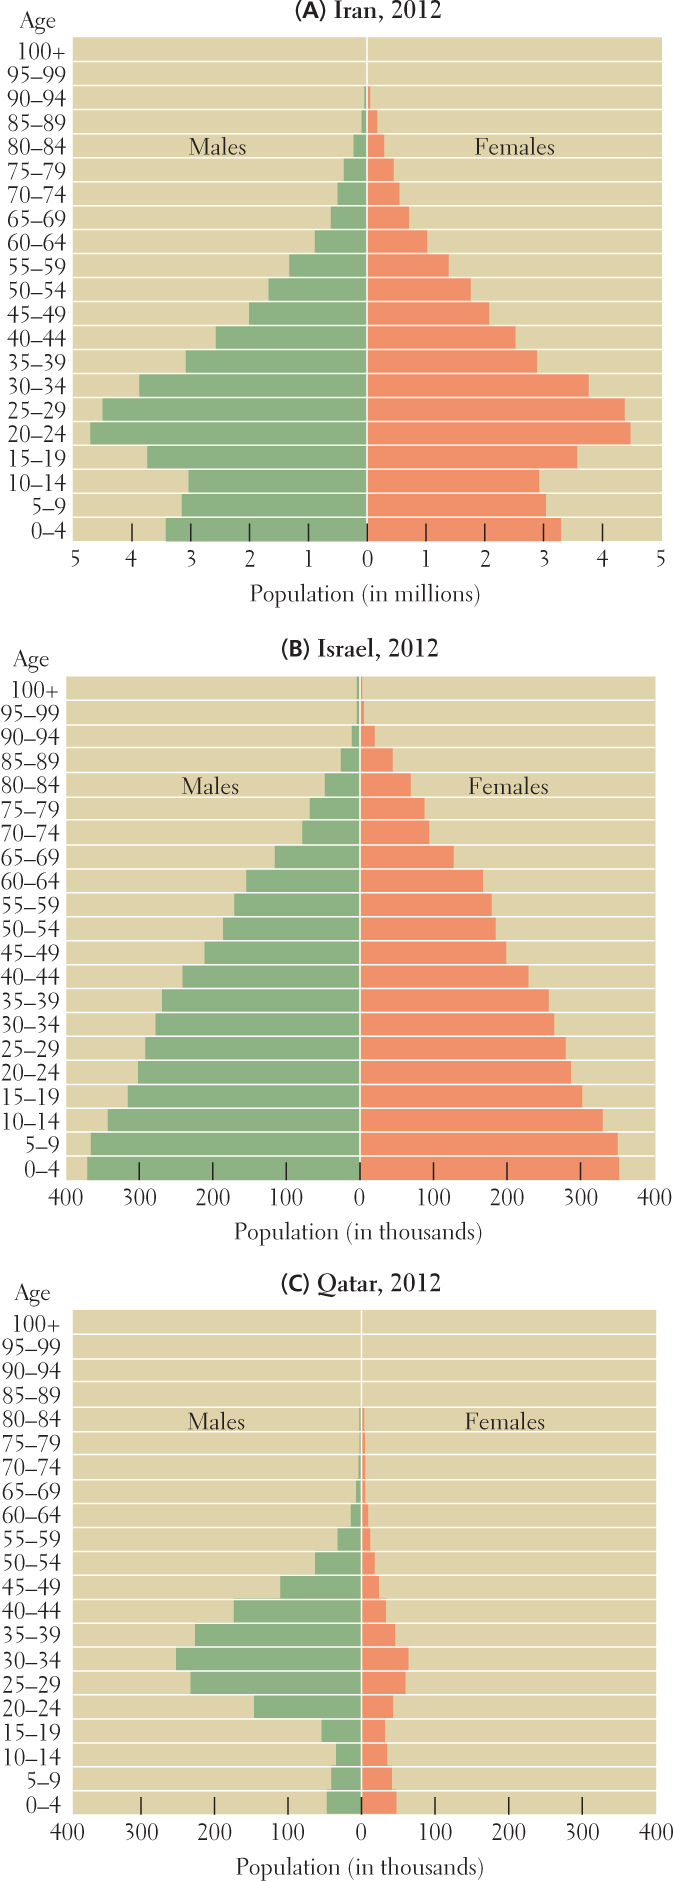
Figure 6.25: Population pyramids for Iran, Israel, and Qatar. The population pyramid for Iran (A) is at a different scale (millions) from those for Israel (B) and Qatar (C) (thousands). The imbalance of Qatar’s pyramid in the 25– 54 age groups is caused by the presence of numerous male guest workers. Note, too, that pyramids A and C show missing females in the younger age groups. (This is most easily observed by drawing lines from the ends of the male and female age bars to the scale at the bottom of the pyramid and comparing the numbers.)
[Source consulted: “Population Pyramids for Iran,” International Data Base, U.S. Census Bureau, 2012, at http://www.census.gov/population/international/data/idb/informationGateway.php]