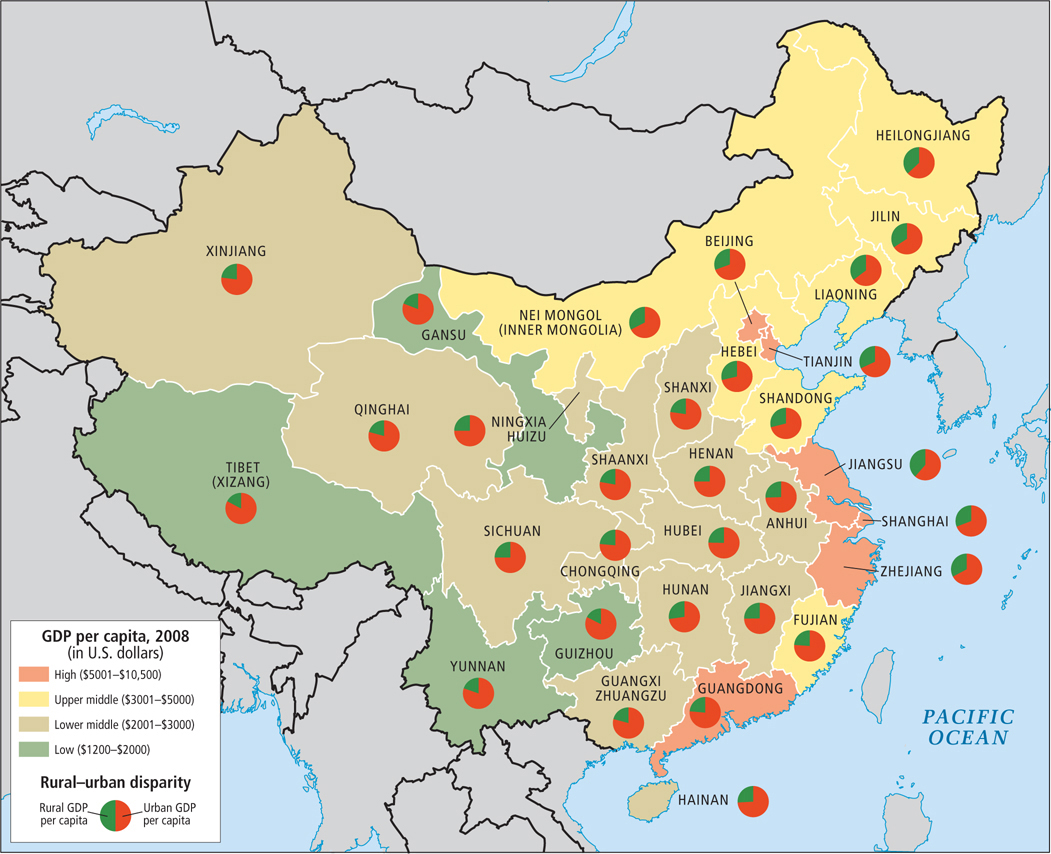
Figure 9.16: China’s regional GDP and rural– urban income per capita disparities, 2008. Notice the disparity in GDP per capita across China, as indicated by the colors of the provinces, as well as the rural– urban income disparity in each province, as represented by the pie diagrams.
[Sources consulted: Invest in China, “Per Capita Cash Income of Rural Households by Region (Third Quarter, 2009),” at http://www.stats.gov.cn/English/Statisticaldata/QuarterlyData/200911/t20091102_56720.html; “Income of Urban Households by Region (Third Quarter, 2009),” at http://www.fdi.gov.cn/pub/FDI_EN/Economy/Investment%20Environment/Macroeconomic%20Indices/Population%20&%20GDP/t20091120_114779.htm]