4.3 ENVIRONMENTAL ISSUES
GEOGRAPHIC INSIGHT 1
Environment: The European Union (EU) is a world leader in responding to climate change. Its goals for cutting greenhouse gas emissions are complemented by its many other strategies for saving energy and resources. However, much of Europe’s air and many of its seas and rivers are very polluted, and consumption patterns in the region impact environments across the globe.
Europeans are increasingly aware of just how dramatically they have transformed their environments over the past several thousand years and are now taking action on many fronts. Nevertheless, the European Union still has a long way to go to meet its goals of clean air and water; sustainable development in agriculture, industry, and energy use; and maintenance of biodiversity.
European Leadership in Response to Global Climate Change
Europe leads the world in responsiveness to global climate change, with EU governments having agreed to cut greenhouse gas emissions by 20 percent by 2020. Europe has been more willing than any other region to address climate change, largely because its governments and corporations see economic advantages to doing so. Recent research suggests that investments in energy conservation, alternative energy, and other measures would cost EU economies 1 percent of their GDP. By contrast, doing nothing about climate change could shrink GDP by 20 percent.
 83. GERMAN INVESTMENTS IN CLEAN ENERGY PAY OFF
Europe’s increasing concern about global warming may also be influenced by public alarm at recent extreme weather. The summers of 2003 and 2012 broke high-
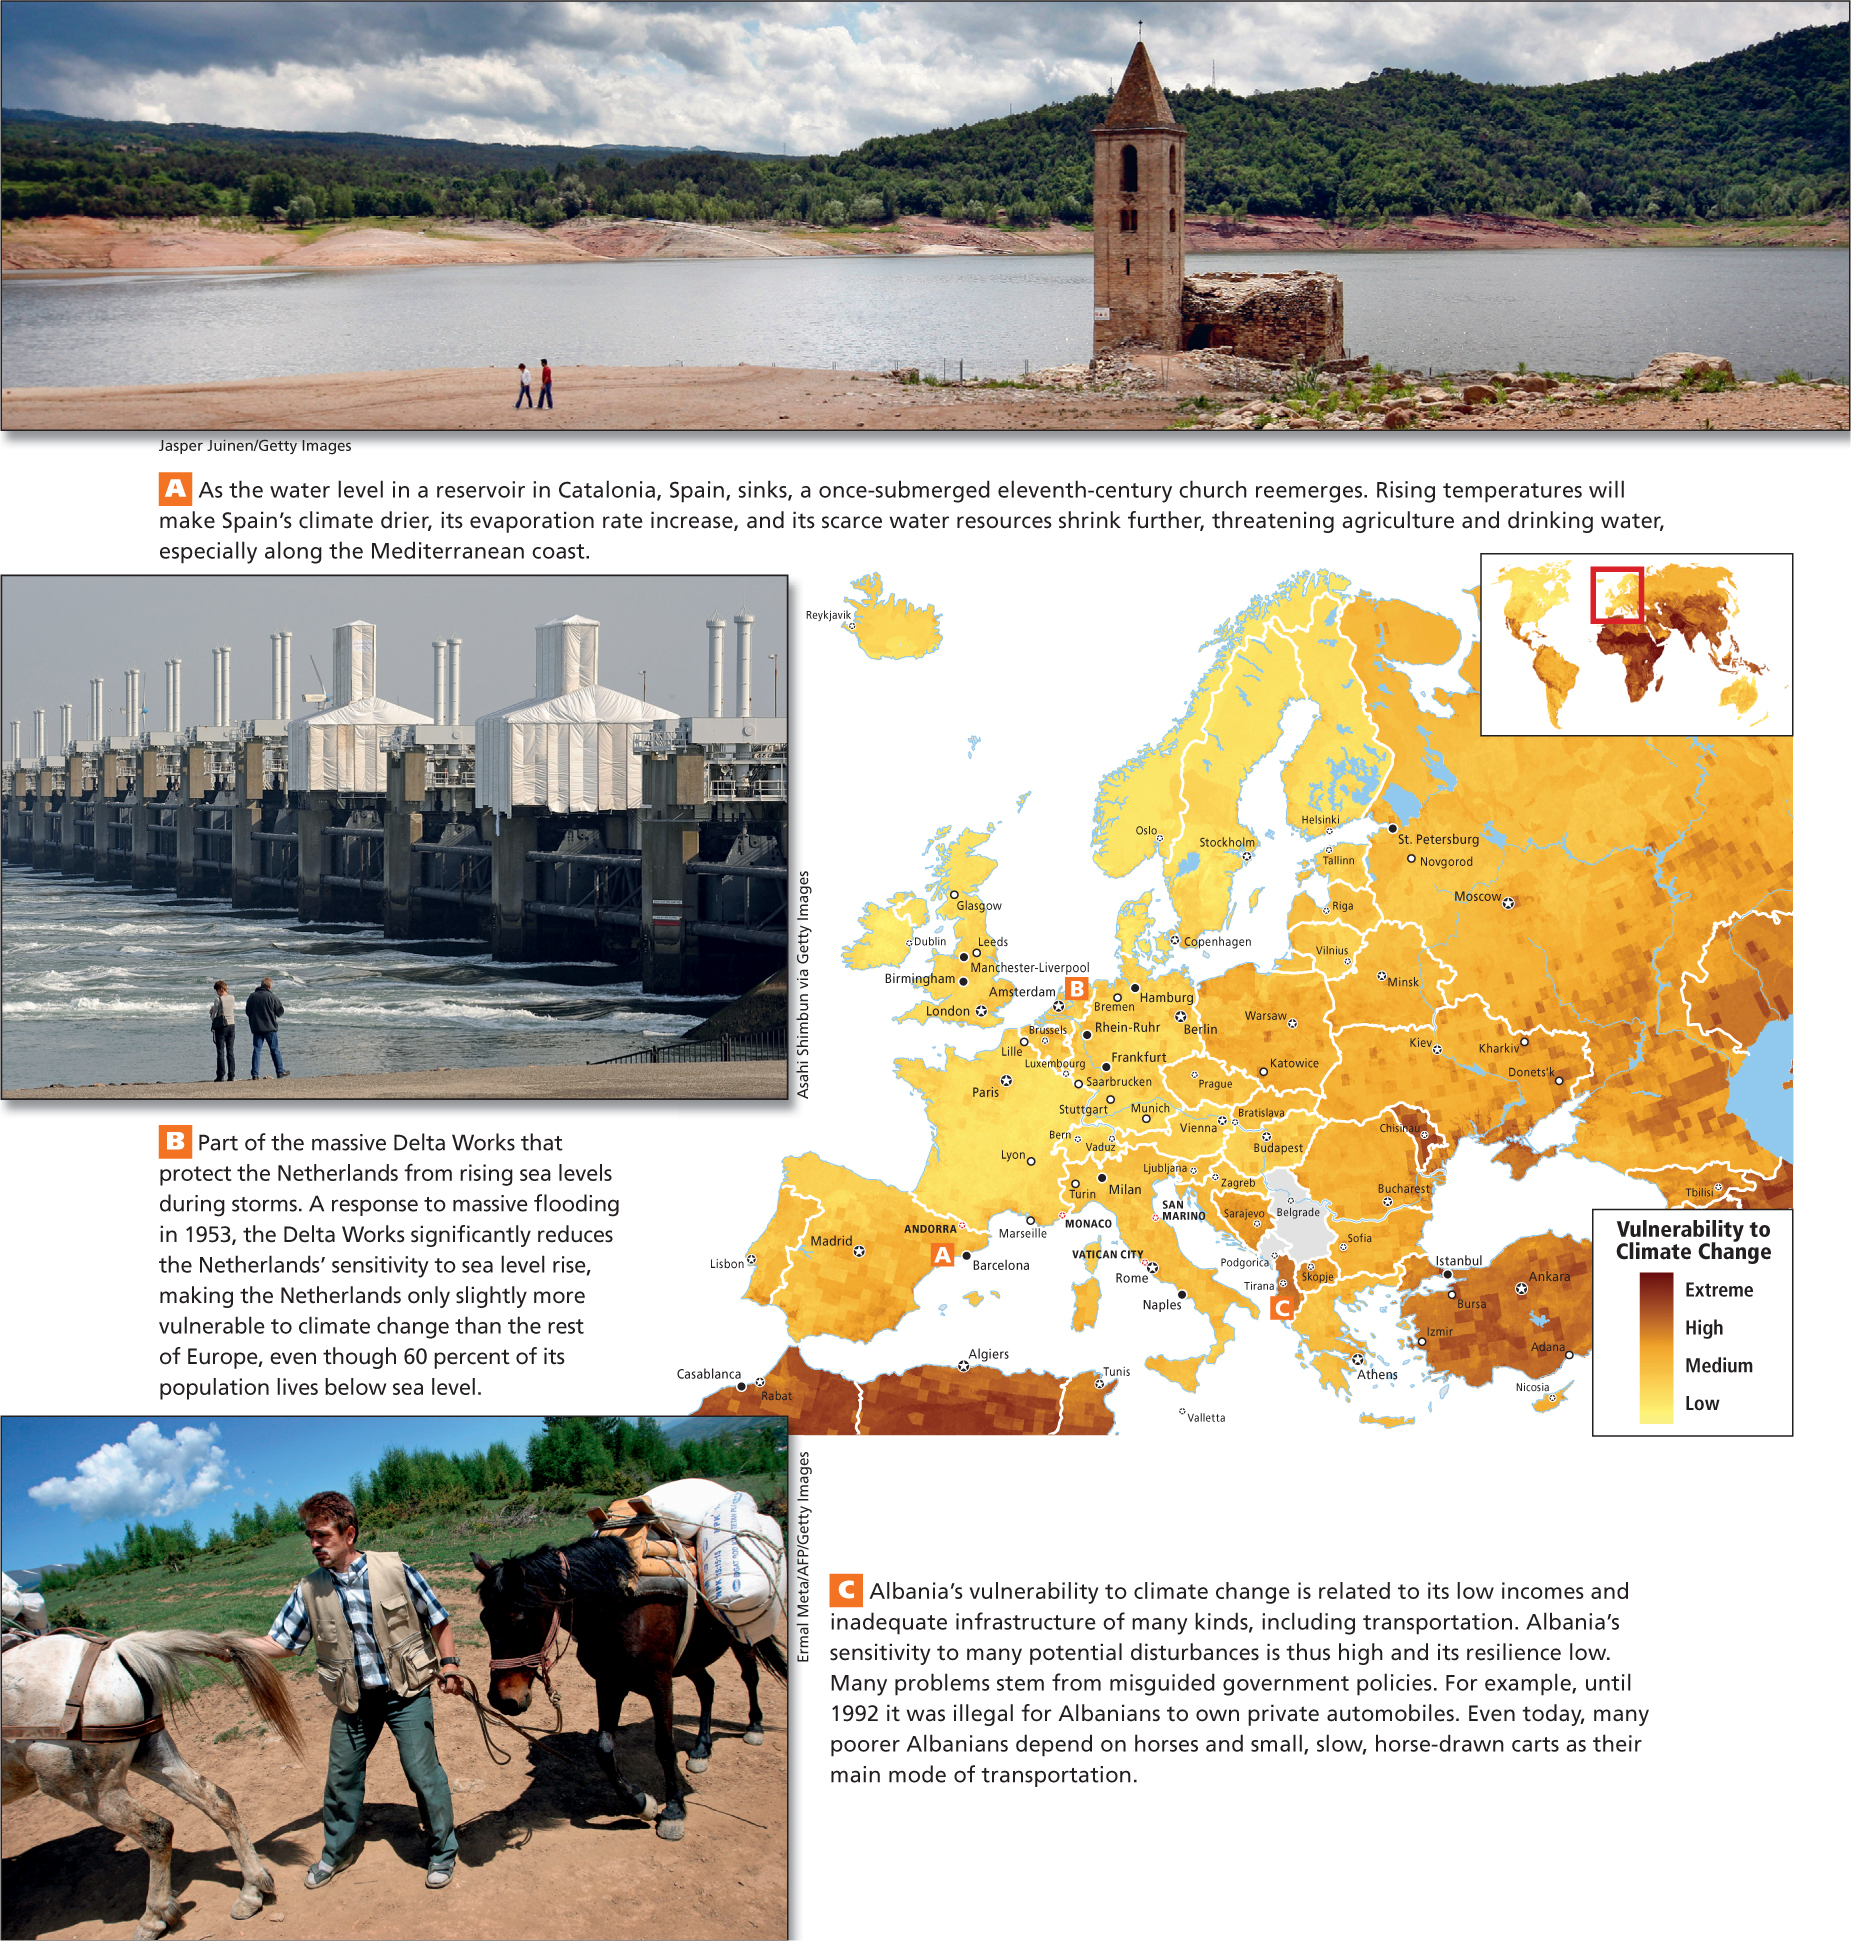
Europe’s Vulnerability to Climate Change Europe’s wealth, technological sophistication, and well-
THINKING GEOGRAPHICALLY
Use the Photo Essay above to answer these questions.
Question 4.2
A What clues in this photo, other than the caption, indicate that the reservoir is at a very low level?
Question 4.3
B Judging from the way these structures are arranged, how would you guess they work?
Question 4.4
C How might owning a car decrease a family’s sensitivity to flooding?
Europe’s Green Behavior By global standards, Europeans use large amounts of resources and contribute about one-
These energy-
Green environmentally conscious
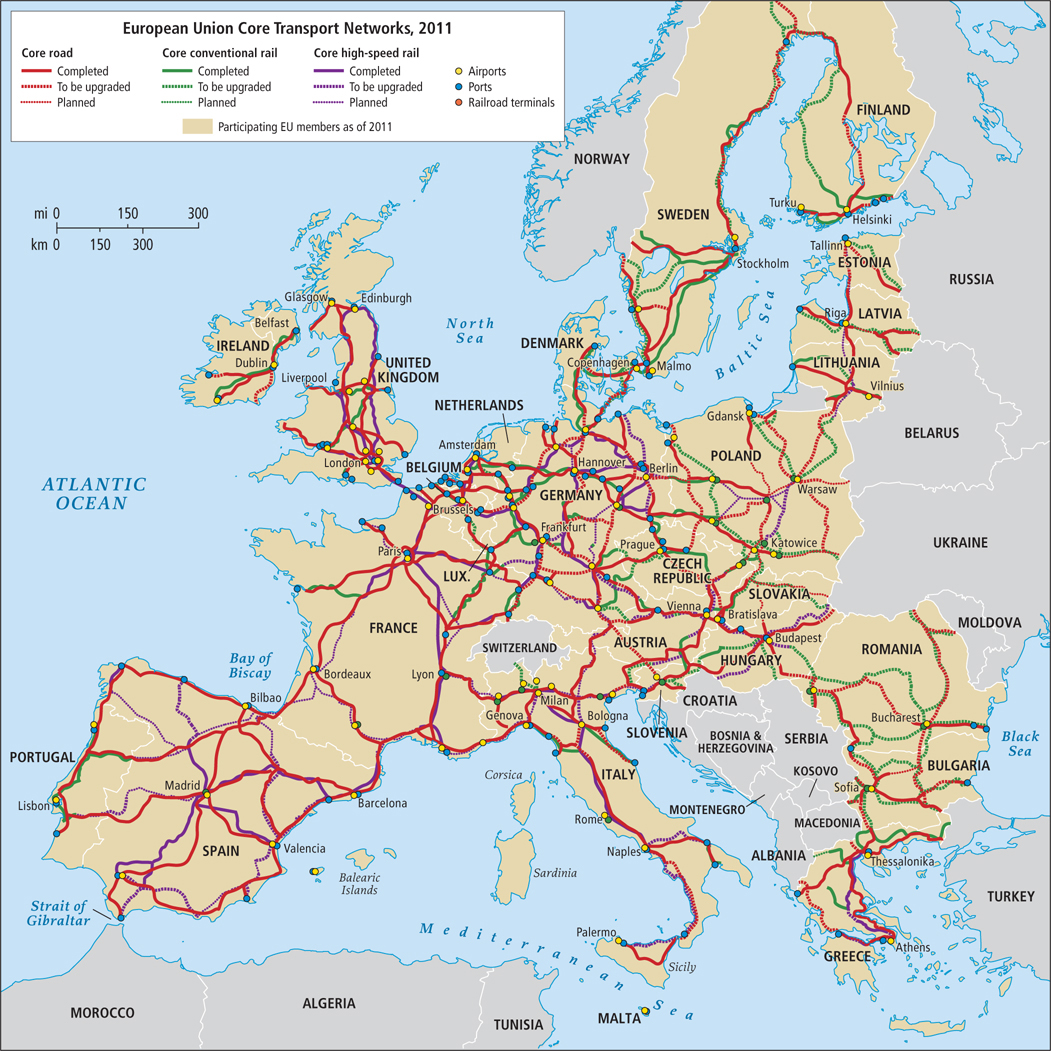
Changes in Transportation Although Europeans have for many years favored fast rail networks for both passengers and cargo (see Figure 4.20D) rather than private cars, trucks, and multilane highways, they have recently been drifting closer to the American model of private cars and trucks driven on sweeping freeways. This change is now happening in even the poorest parts of Europe, where cars have been scarce in the past (see Figure 4.5C). In response to rising fuel costs and CO2 emissions, though, the European Union has developed long-
ON THE BRIGHT SIDE
Guerrilla Gardeners
Under cover of darkness, gardeners—
Bypassing the town councils (which tend to impose crippling rules), the Guerrilla Gardeners make quick assaults late at night, armed with trowels, spades, mulch, and watering cans. Authorities seem unable to stop the guerrillas from covering neglected urban land with blooming hyacinths, tulips, marigolds, shrubs, and even trees. Sneakier yet are the Seed Bombers, a group that packs flower seeds, soil, and water into compact parcels and tosses them into derelict patches of public land, where they shatter on impact, spewing forth seeds that produce plants capable of outcompeting the weeds. [Source: NPR. For detailed source information, see Text Sources and Credits; see also Philip Booth’s “Seed Bombers in Stroud,” at http:/
Europe’s long, irregular coastline and the low cost of water transportation have been a boon for the development of links to global trade. Europe has numerous modern ocean ports that cater to container ships: Helsinki, Riga, Hamburg, Copenhagen, Antwerp, Rotterdam, Plymouth, Southampton, Le Havre, Marseille, Barcelona, and Koper. Soon, newly built Mediterranean ports in Morocco, Algeria, Tunisia, Malta, and Egypt, all of which cater at least in part to European markets, will join these ports. One-
Europe’s Impact on the Biosphere
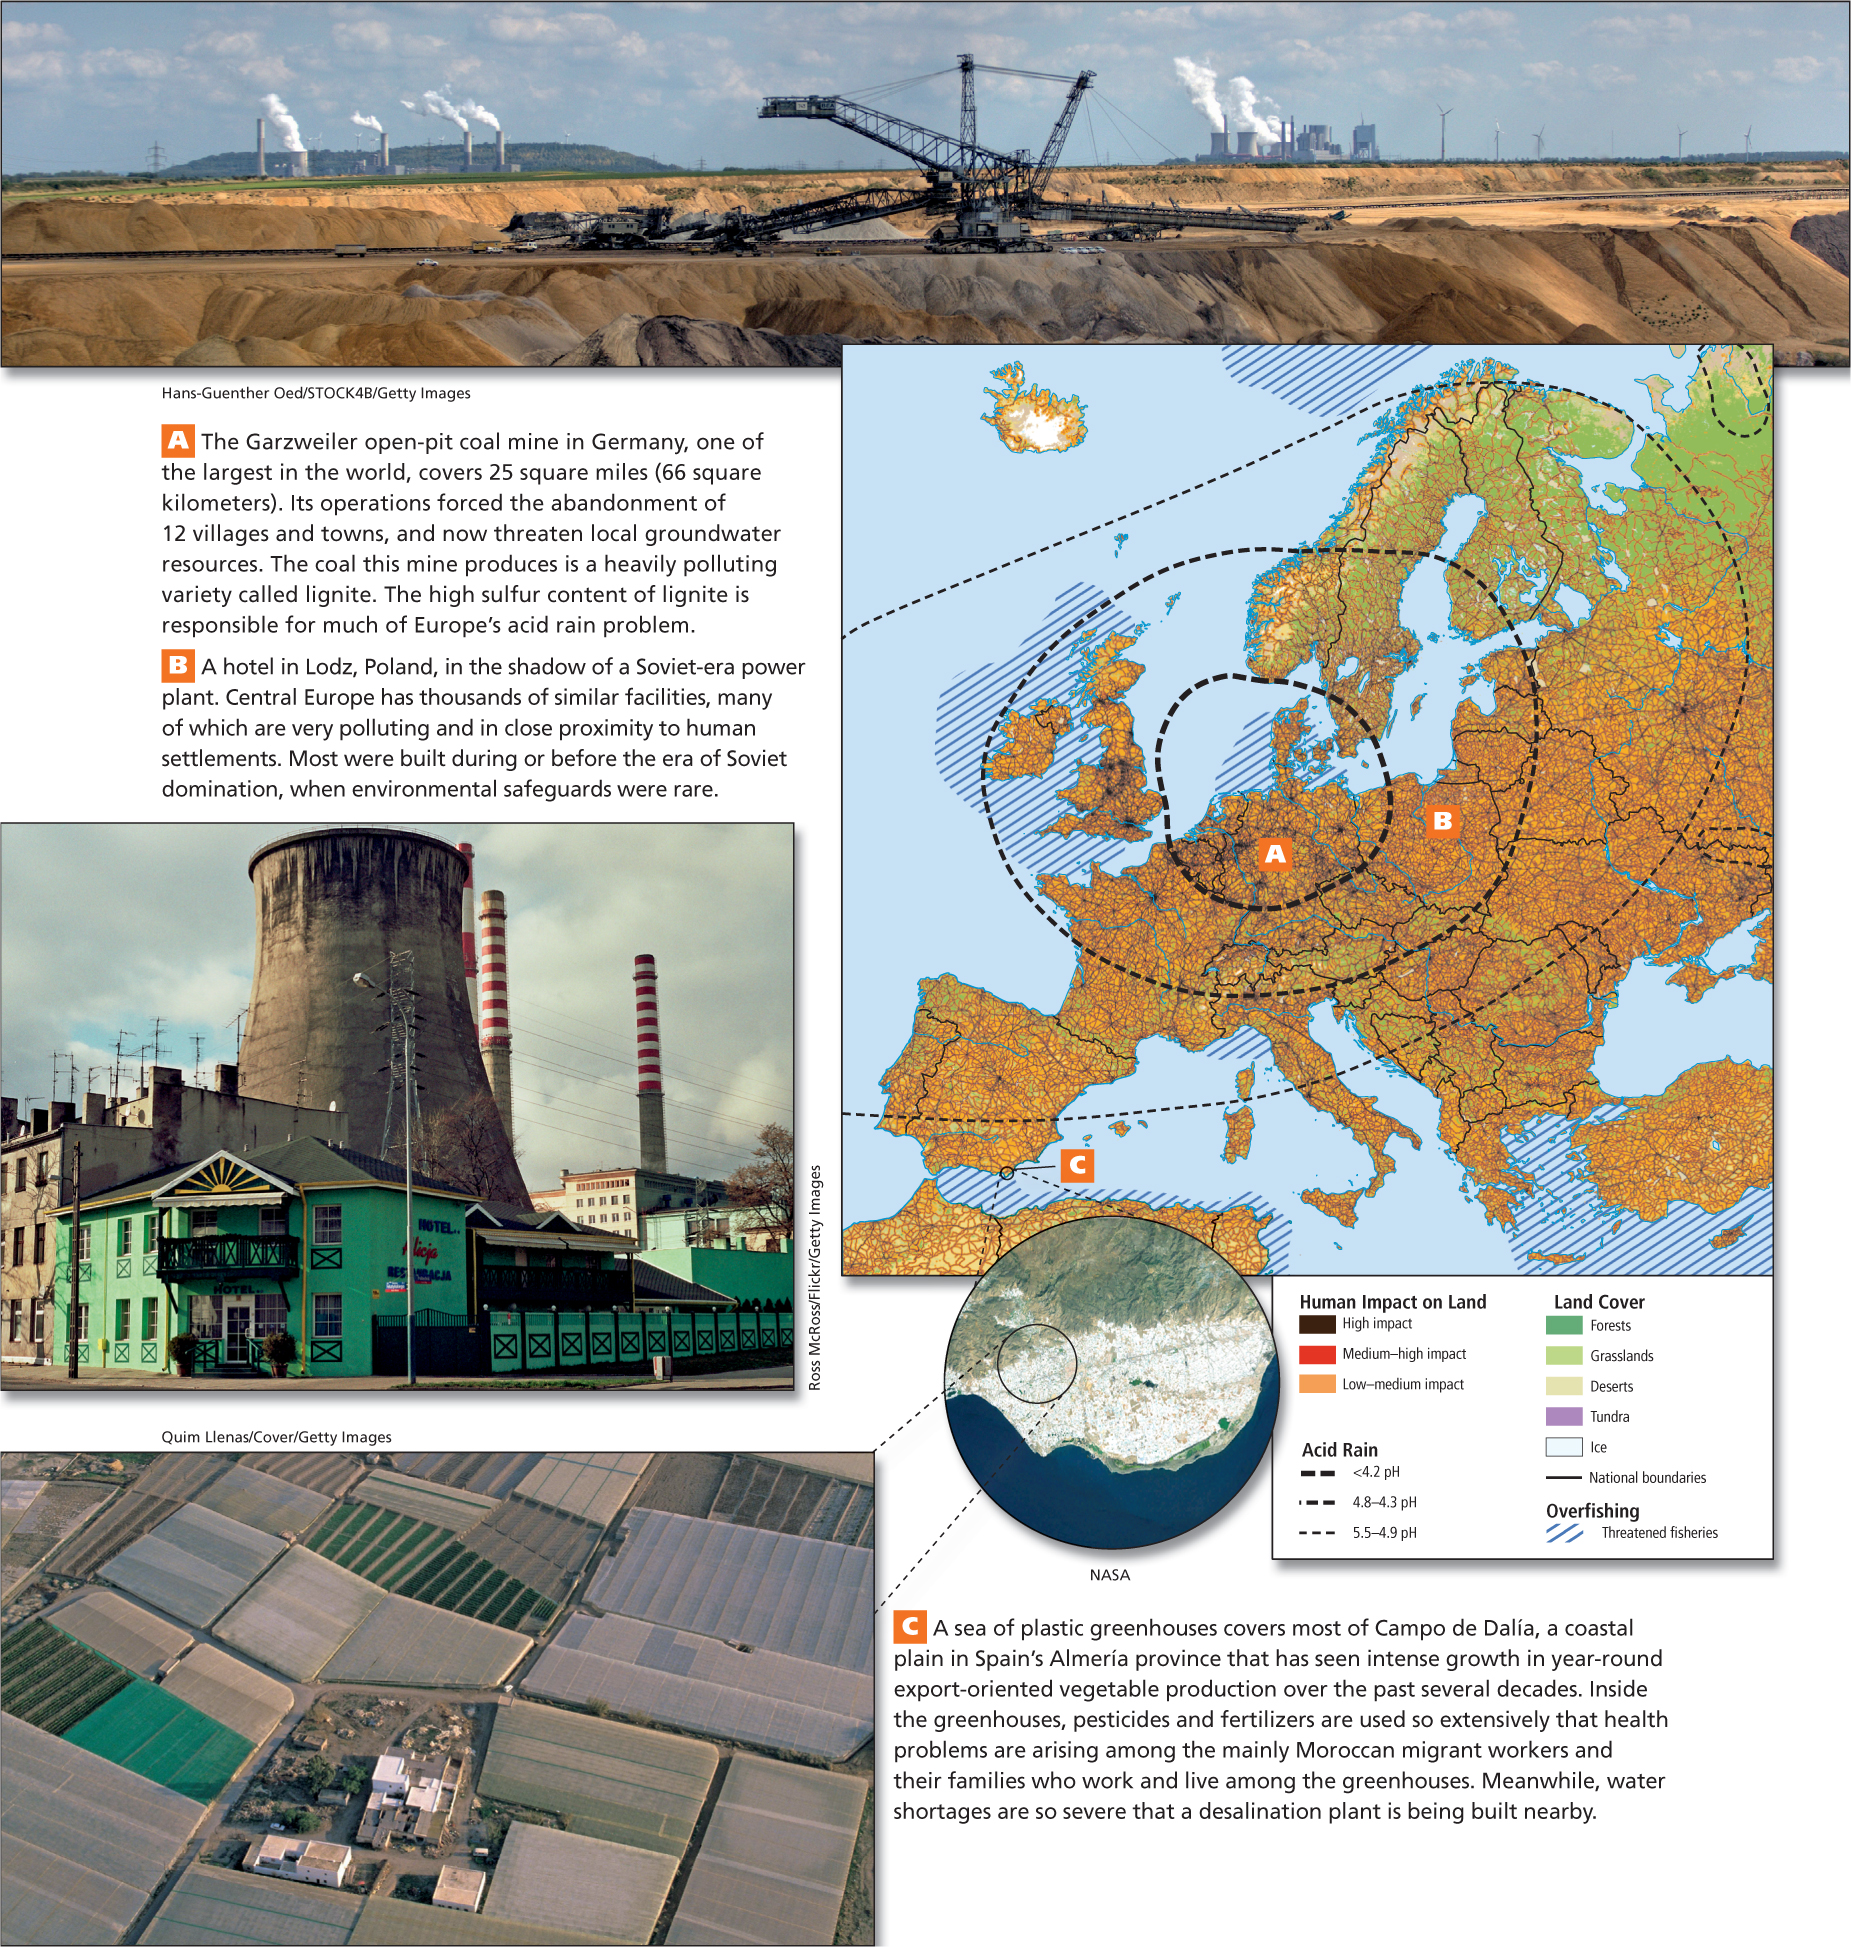
There is a geographic pattern to the ways in which human activities have transformed Europe’s landscapes over time. Western Europe shows the effects of dense population and heavy industrialization (Figure 4.7A), and Central Europe reveals the results of long decades of willful disregard for the environment. Central Europe continues to have a major impact on the biosphere through the air and water pollution it generates (see Figure 4.7B).
THINKING GEOGRAPHICALLY
Use the Photo Essay above to answer these questions.
Question 4.5
A How might this large, open pit threaten groundwater resources?
Question 4.6
B What clue(s) in the picture shows that large numbers of people may be exposed to pollution from the power plant?
Question 4.7
C How might the large areas covered by plastic contribute to a water shortage?
Europe’s Energy Resources Europe’s main energy sources have shifted over the years from wood to coal and, more recently, to petroleum and natural gas and in some countries to nuclear power. Europe is now leading the move to renewable energy sources in response to rising energy costs and commitments to cut greenhouse gas emissions.
The 28 members of the European Union (the EU-
Another 30 percent of the gas and oil that the European Union consumes comes from various Middle Eastern producers. Large oil and gas deposits in the North Sea, most controlled by Norway (not an EU member), have alleviated Europe’s dependence on “foreign” sources of energy, but the production of oil from the North Sea has already peaked and is expected to run out sometime in the next decade.
The use of nuclear power to generate electricity has been more common in Europe than in North America. The EU-
Air Pollution At present, there is significant air pollution in much of Europe, but it is particularly heavy over the North European Plain. This is a region of heavy industry, dense transportation routes, and large and affluent populations. The intense fossil fuel use associated with such lifestyles results not only in the usual air pollution but also in acid rain, which can fall far from where it was generated (see the Figure 4.7 map).
There is also much air pollution in the former communist states of Central and North Europe. Mines in Central Europe produce highly polluting soft coal that is burned in out-
Central Europe’s severe environmental problems developed in part because the theories and policies promoted by the Soviet Union portrayed nature as existing only to serve human needs. During the Soviet era, little pollution data was collected and public protest against pollution was prohibited, but because of the recent shift toward democracy in places like Hungary and Bulgaria, more activism has been possible, and popular protest has resulted in reductions in air pollution.
The new market economies in the former Soviet bloc countries are improving energy efficiency and reducing emissions. Power plants, factories, and agriculture are polluting less, and the countries with the worst emissions records, such as Poland, have been making the most progress.
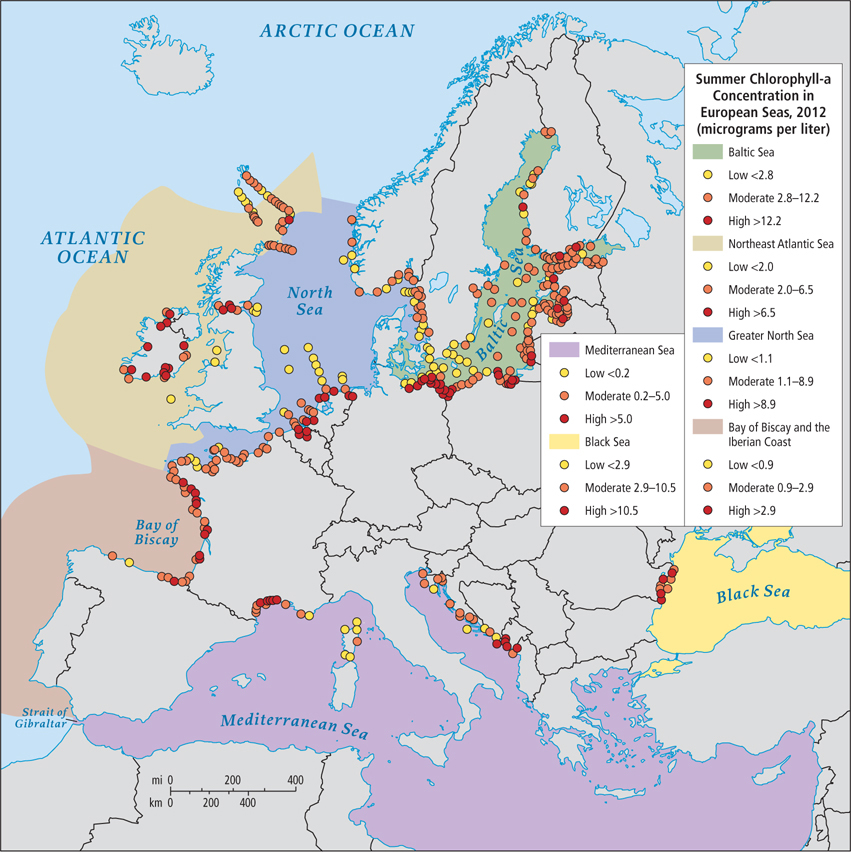
Freshwater and Seawater Pollution Sources of water pollution in Europe include insufficiently treated sewage, chemicals and silt in the runoff from agricultural plots and urban areas, consumer packaging litter, petroleum residues, and industrial effluent. Most inland waters contain a variety of such pollutants. Any pollutants that enter Europe’s inland wetlands, rivers, streams, and canals eventually reach Europe’s surrounding coastal waters. The Atlantic Ocean, the Arctic Ocean, and the northern reaches of the North Sea are better able to disperse chemical pollutants dumped into them because they are part of, or closely connected to, the circulating flow of the world ocean. In contrast, the Baltic, Mediterranean, and Black seas, along with the southern North Sea, are nearly landlocked bodies of water that do not have the capacity to flush themselves out quickly and are prone to accumulating chemical pollution (see the red areas in Figure 4.8).
ON THE BRIGHT SIDE
Energy Solutions
The European Union wants to increase its use of renewable energy in order to reduce fuel imports and thereby increase energy security, stimulate the economy with new energy-
In the Mediterranean, the effect of the pollution that pours in from rivers, adjacent cities, industries, hotel resorts, and farms is exacerbated by the fact that the sea has just one tiny opening to the world ocean (see Figure 4.8). At the surface, seawater flows in from the Atlantic through the narrow Strait of Gibraltar and moves eastward. At the bottom of the sea, water exits through the same narrow opening, but only after it has been in the Mediterranean for 80 years. The natural ecology of the Mediterranean is attuned to this lengthy cycle, but the nearly 460 million people now living in the countries surrounding the sea have upset the balance. Their pollution stays in the Mediterranean for decades. As a result, fish catches have declined, beloved seaside resorts have become unsafe for swimmers, and agricultural workers have become sick.
There are 34 countries with coastlines on Europe’s many seas, all with different economies, politics, and cultural traditions. Such diversity makes it difficult to cooperate to minimize pollution or even reduce the risk of severe pollution. Although most of the Mediterranean’s pollution is generated by Europe, rapidly growing populations and economic development on the North African and eastern Mediterranean coasts of the sea also pose environmental threats because these countries still lack adequate urban sewage treatment and environmental regulations to control agricultural and industrial wastes.
The Wide Reach of Europe’s Environmental Impact The term virtual water, introduced in Chapter 1 as the volume of water required to produce, process, and deliver a good or service that a person consumes, has come into use as fresh water becomes more scarce. In Chapter 1, we discussed average per capita water needs per day (5 to 13 gallons [20 to 30 liters]) and noted that to arrive at a person’s annual total water footprint, one must add the water required for basic needs to a person’s virtual water footprint (see Table 1.1). Although Europeans do not import as many of their consumer goods as do Americans, they still consume one-
THINGS TO REMEMBER
GEOGRAPHIC INSIGHT 1
Environment The European Union (EU) is a world leader in responding to climate change. Its goals for cutting greenhouse gas emissions are complemented by its many other strategies for saving energy and resources. However, much of Europe’s air and many of its seas and rivers are very polluted, and consumption patterns in the region impact environments across the globe.
Recent research suggests that investments in energy conservation, alternative energy, and other measures would cost EU economies 1 percent of their GDP. By contrast, doing nothing about climate change could shrink GDP by 20 percent.
European residents average only one-
half the energy consumption of the average North American. Fuel costs and CO2 emissions are increasingly being considered in the design of multimodal transport that links high- speed rail to road, air, and water transportation. Europe’s main energy sources have shifted over the years from wood to coal and more recently to petroleum and natural gas, and in some countries to nuclear power.
In the Mediterranean, the effect of the pollution that pours in from rivers, adjacent cities, industries, hotel resorts, and farms is exacerbated by the fact that there is just one tiny opening to the world ocean.