Chapter 1. Impact 12.1
Impact …ON BIOCHEMISTRY: I12.1 Differential scanning calorimetry
A differential scanning calorimeter (DSC) measures the energy transferred as heat to or from a sample at constant pressure during a physical or chemical change. The term ‘differential’ refers to the fact that the behaviour of the sample is compared to that of a reference material that does not undergo a physical or chemical change during the analysis. The term ‘scanning’ refers to the fact that the temperatures of the sample and reference material are increased, or scanned, during the analysis.
A DSC consists of two small compartments that are heated electrically at a constant rate (Fig. 1). The temperature, T, at time t during a linear scan is T = T0 + αt, where T0 is the initial temperature and α is the scan rate. A computer controls the electrical power supply that maintains the same temperature in the sample and reference compartments throughout the analysis.
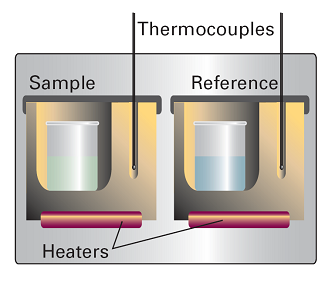
Fig. 1. A differential scanning calorimeter. The sample and a reference material are heated in separate but identical metal heat sinks. The output is the difference in power needed to maintain the heat sinks at equal temperatures as the temperature rises.
If no physical or chemical change occurs in the sample at temperature T, we write the heat transferred to the sample as qp= CpΔT, where ΔT = T − T0 and we have assumed that Cp is independent of temperature. Because T = T0 + αt, ΔT = αt. The chemical or physical process requires the transfer of qp + qp,ex, where qp,ex is the excess energy transferred as heat needed to attain the same change in temperature of the sample as the control. The quantity qp,ex is interpreted in terms of an apparent change in the heat capacity at constant pressure of the sample, Cp,ex during the temperature scan:
Cp,ex=qp,exΔT=qp,exαt=Pexα
where Pex = qp,ex/t is the excess electrical power necessary to equalize the temperature of the sample and reference compartments. A DSC trace, also called a thermogram, consists of a plot of Cp,ex against T (Fig. 2). The enthalpy change associated with the process is
ΔH=∫T2T1Cp,exdT
where T1 and T2 are, respectively, the temperatures at which the process begins and ends. This relation shows that the enthalpy change is equal to the area under the plot of Cp,ex against T.
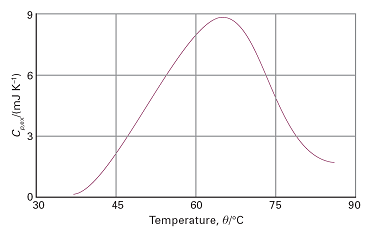
Fig. 2. A thermogram for the protein ubiquitin at pH = 2.45. The protein retains its native structure up to about 45 ºC and then undergoes an endothermic conformational change. (Adapted from B. Chowdhry and S. LeHarne, J. Chem. Educ. 74, 236 (1997).)
The technique is used, for instance, to assess the stability of proteins, nucleic acids, and membranes. The thermogram shown in Fig. 2 indicates that the protein ubiquitin undergoes an endothermic conformational change in which a large number of non-covalent interactions (such as hydrogen bonds) are broken simultaneously and result in denaturation, the loss of the protein’s three-dimensional structure. The area under the curve represents the heat absorbed in this process and can be identified with the enthalpy change. The thermogram also reveals the formation of new intermolecular interactions in the denatured form. The increase in heat capacity accompanying the native → denatured transition reflects the change from a more compact native conformation to one in which the more exposed amino acid side chains in the denatured form have more extensive interactions with the surrounding water molecules.
Isothermal titration calorimetry (ITC) is also a ‘differential’ technique in which the thermal behaviour of a sample is compared with that of a reference. The apparatus is shown in Fig. 3. One of the thermally conducting vessels, which have a volume of a few millilitres (1 mL = 1 mm3), contains the reference (water for instance) and a heater rated at a few milliwatts. The second vessel contains one of the reagents, such as a solution of a macromolecule with binding sites; it also contains a heater. At the start of the experiment, both heaters are activated, and then precisely determined amounts (of volume of about a microlitre, 10–9 m3) of the second reagent are added to the reaction cell. The power required to maintain the same temperature differential with the reference cell is monitored. If the reaction is exothermic, less power is needed; if it is endothermic, then more power must be supplied.
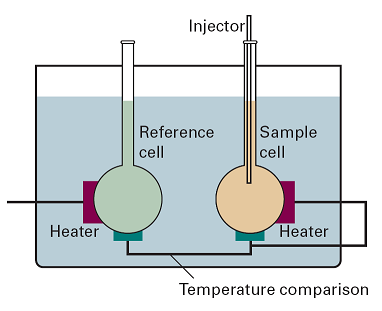
Fig. 3. A schematic diagram of the apparatus used for isothermal titration calorimetry.
A typical result is shown in Fig. 4, which shows the power needed to maintain the temperature differential: from the power and the length of time, δt, for which it is supplied, the heat supplied, δqi, for the injection i can be calculated from δqi = Piδt. If the volume of solution is V and the molar concentration of unreacted reagent A is ci at the time of the ith injection, then the change in its concentration at that injection is δci and the heat generated (or absorbed) by the reaction is VΔrHδci = δqi. The sum of all such quantities, given that the sum of δci is the known initial concentration of the reactant, can then be interpreted as the value of ΔrH for the reaction.
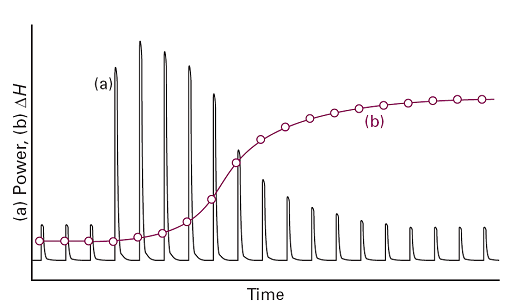
Fig. 4. (a) The record of the power applied as each injection is made, and (b) the sum of successive enthalpy changes in the course of the titration.