Chapter 1. Impact 8.1
Impact …ON BIOCHEMISTRY: I8.1 X-ray crystallography of biological macromolecules
X-ray crystallography is the deployment of X-ray diffraction techniques for the determination of the location of all the atoms in molecules, including those as complicated as biopolymers. Bragg’s law (eqn 37.2a in the form nλ = 2d sin θ) helps us understand the features of one of the most seminal X-ray images of all, the characteristic X-shaped pattern obtained by Rosalind Franklin and Maurice Wilkins from strands of DNA, and used by James Watson and Francis Crick in their construction of the double-helix model of DNA (Fig. 1). To interpret this image by using Bragg’s law we have to be aware that it was obtained by using a fibre consisting of many DNA molecules oriented with their axes parallel to the axis of the fibre, with X-rays incident from a perpendicular direction. All the molecules in the fibre are parallel (or nearly so) but are randomly distributed in the perpendicular directions; as a result, the diffraction pattern exhibits the periodic structure parallel to the fibre axis superimposed on a general background of scattering from the distribution of molecules in the perpendicular directions.
There are two principal features in Fig. 1: the strong ‘meridional’ scattering upward and downward by the fibre and the X-shaped distribution at smaller scattering angles. Because scattering through large angles occurs for closely spaced features (from Bragg’s law, if d is small, then θ must be large to preserve the equality), we can infer that the meridional scattering arises from closely spaced components and that the inner X-shaped pattern arises from features with a longer periodicity. Because the meridional pattern occurs at a distance of about 10 times that of the innermost spots of the X-pattern, the large-scale structure is about 10 times bigger than the small-scale structure. From the geometry of the instrument, the wavelength of the radiation, and Bragg’s law, we can infer that the periodicity of the small-scale feature is 340 pm whereas that of the large-scale feature is 3400 pm (that is, 3.4 nm).
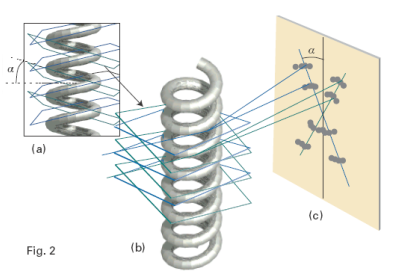
To see that the cross is characteristic of a helix, look at Fig. 2. Each turn of the helix defines two planes, one orientated at an angle α to the horizontal and the other at −α. As a result, to a first approximation, a helix can be thought of as consisting of an array of planes at an angle α together with an array of planes at an angle −α with a separation within each set determined by the pitch of the helix. Thus, a DNA molecule is like two arrays of planes, each set corresponding to those treated in the derivation of Bragg’s law, with a perpendicular separation d = p cos α, where p is the pitch of the helix, each canted at the angles ±α to the horizontal. The diffraction spots from one set of planes therefore occur at an angle α to the vertical, giving one leg of the X, and those of the other set occur at an angle −α, giving rise to the other leg of the X. The experimental arrangement has up–down symmetry, so the diffraction pattern repeats to produce the lower half of the X. The sequence of spots outward along a leg corresponds to first-, second-,… order diffraction (n = 1, 2, … in Bragg’s law). Therefore from the X-ray pattern, we see at once that the molecule is helical and we can measure the angle α directly, and find α = 40°. Finally, with the angle α and the pitch p determined, we can determine the radius r of the helix from tan α = p/4r, from which it follows that r = (3.4 nm)/(4 tan 40°) = 1.0 nm.
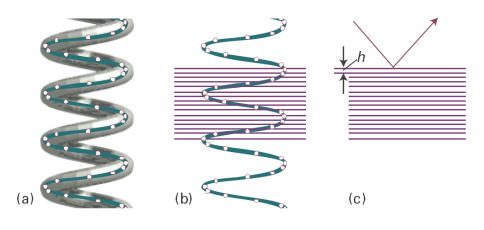
To derive the relation between the helix and the cross-like pattern we have ignored the detailed structure of the helix, the fact that it is a periodic array of nucleotide bases, not a smooth wire. In Fig. 3 we represent the bases by points, and see that there is an additional periodicity of separation h, forming planes that are perpendicular to the axis of the molecule (and the fibre). These planes give rise to the strong meridional diffraction with an angle that allows us to determine the layer spacing from Bragg’s law in the form λ = 2h sin θ as h = 340 pm.

Fig. 1. The X-ray diffraction pattern obtained from a fibre of B-DNA. The black dots are the reflections, the points of maximum constructive interference, that are used to determine the structure of the molecule. (Adapted from an illustration that appears in J.P. Glusker and K.N. Trueblood, Crystal structure analysis: A primer. Oxford University Press (1972).)

Fig. 2. The origin of the X pattern characteristic of diffraction by a helix. (a) A helix can be thought of as consisting of an array of planes at an angle α together with an array of planes at an angle −α. (b) The diffraction spots from one set of planes appear at an angle α to the vertical, giving one leg of the X, and those of the other set appear at an angle −α, giving rise to the other leg of the X. The lower half of the X appears because the helix has up-down symmetry in this arrangement. (c) The sequence of spots outward along a leg of the X corresponds to first-, second-, … order diffraction (n = 1, 2, …).

Fig. 3. The effect of the internal structure of the helix on the X-ray diffraction pattern. (a) The residues of the macromolecule are represented by points. (b) Parallel planes passing through the residues are perpendicular to the axis of the molecule. (c) The planes give rise to strong diffraction with an angle that can be used to determine the layer spacing h from λ = 2h sin θ.